yeah memory usage is one of the main indicators i use to tell if nodes are running poorly.
No!!!
There really is an issue with (now) v1.61.1 and docker in synology.
Since I last wrote about it, the used memory of the node has been swinging between 3 and 10 GB. But let’s forget about that. One could say I didn’t solve the cache problem by adding a RO nvme.
I deployed a new storage node on another synology (fresh DSM install) and the used memory at one point was larger than the storage. The storage is at the moment 6.9GB and the used memory is 2.78GB. This can not be explained by too much database IO going on.
Is the %util parameter still high?
Not at the moment (30-60%). But at the moment, the used memory is “low” at 2.3 GB. When it reaches 8-10 GB, %util goes up to 90-100%.
On the new node the %util is very low (4%), but the memory is ~half the size of the node.
The memory used to be ~100MB on the old node.
I have only SN on a test network (very little data traffic), DSM 6.2.3, for 20 hours already SN in v1.62.3
ext4 single-disk volume (not BTRFS)
are you running multiple nodes on the same array?
not sure what you mean by RO nvme, i think a write cache would be the best addition, but not easy to say… clearly your storage doesn’t seem to be able to keep up with the IO.
this can happen for a wide range of reasons… i’ve had a lot of trouble with HDD’s that work fine, but will not sustain high IO workloads, which then stalled out my ZFS pool.
only takes one disk performing poorly to slow everything to a crawl.
and then memory just goes off the charts… there are basically no limits to how much memory it can use, it will just keep climbing until the storage either catches up, or the system is OOM
best advice i can give is to either figure out if your disks are acting up, i like netdata for that.
or try to reduce the workload by caching, or moving io workload to other devices, or add more nodes on different disks… because the ingress is global IP based, having a second node can help make non viable hardware, viable… to a degree atleast…
also this issue is usually only SMR related… most normal HDD’s can keep up with the storj workload… ofc the workload has been going up lately which doesn’t help…
and nodes grow, so the older they get the more traffic, but egress is usually less of an issue, because reading if almost always easier than writing and also more sequential often.
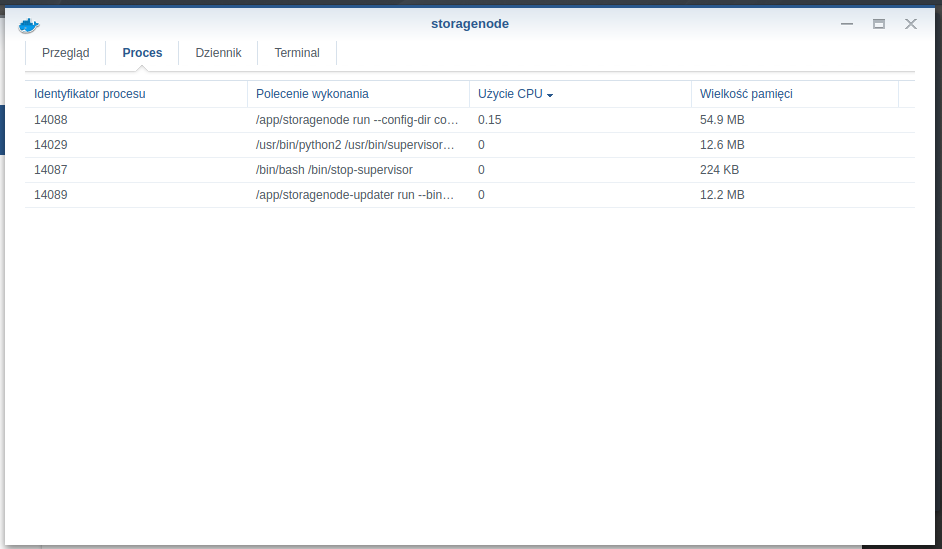
The memory shown in processes is also low, give or take like yours. One could say the memory declared in the syno nodes overview is buggy. But the %util at 90-100% and the minutes it takes to refresh the node dashboard can’t be wrong.
When the node is switched off, such high CPU usage too?
are you running multiple nodes on the same array?
nope. 2 nodes on 2 different synos.
not sure what you mean by RO nvme, i think a write cache would be the best addition, but not easy to say… clearly your storage doesn’t seem to be able to keep up with the IO.
Well, that’s just how it works in a syno. One nvme will only allow for RO cache. For RW cache you need to install 2 nvme’s (raid 1).
The newly deployed node (less than 10GB), I have no complaints. The %util is low and the dashboard page refreshes fast. But already showing “used memory” comparable to the size of the node is strange…
This is the way it has always been…
This is the way it has always been…
Not in my syno.
I run other somewhat problematic containers. I keep an eye on it. I had never seen these memory usage by storj.
Ok. So this what the I/O utilisation of CPU looks like during last August. Until the 13th one can see the CPU was mainly waiting for the disks to catch up. The 13th was when I inserted a nvme RO. From then to the 19th, the CPU was pretty busy with system I/O operations. Now, I’d like to tell you (just because) I inserted another nvme cache and turned it to RW cache on the 19th, but the truth is I only inserted the second nvme and started RW cache on the 29th. The gains don’t look spectacular…
I have no clue about what happened on the 19th. The RO cache (100GB out of 250GB) was almost filled before the 19th. Maybe it was 100% filled on the 19th… BTW, cache is set to the whole volume, not to a small DB volume, something I plan to do in the next few days…

Next, a pic of the I/O calls to one of the disks and one of the nvme cache (raid 1). One can see an increase in I/O calls after the 29th when the cache started to be RW, maybe just because the system could handle it… throughput looks pretty much the same as I/O…
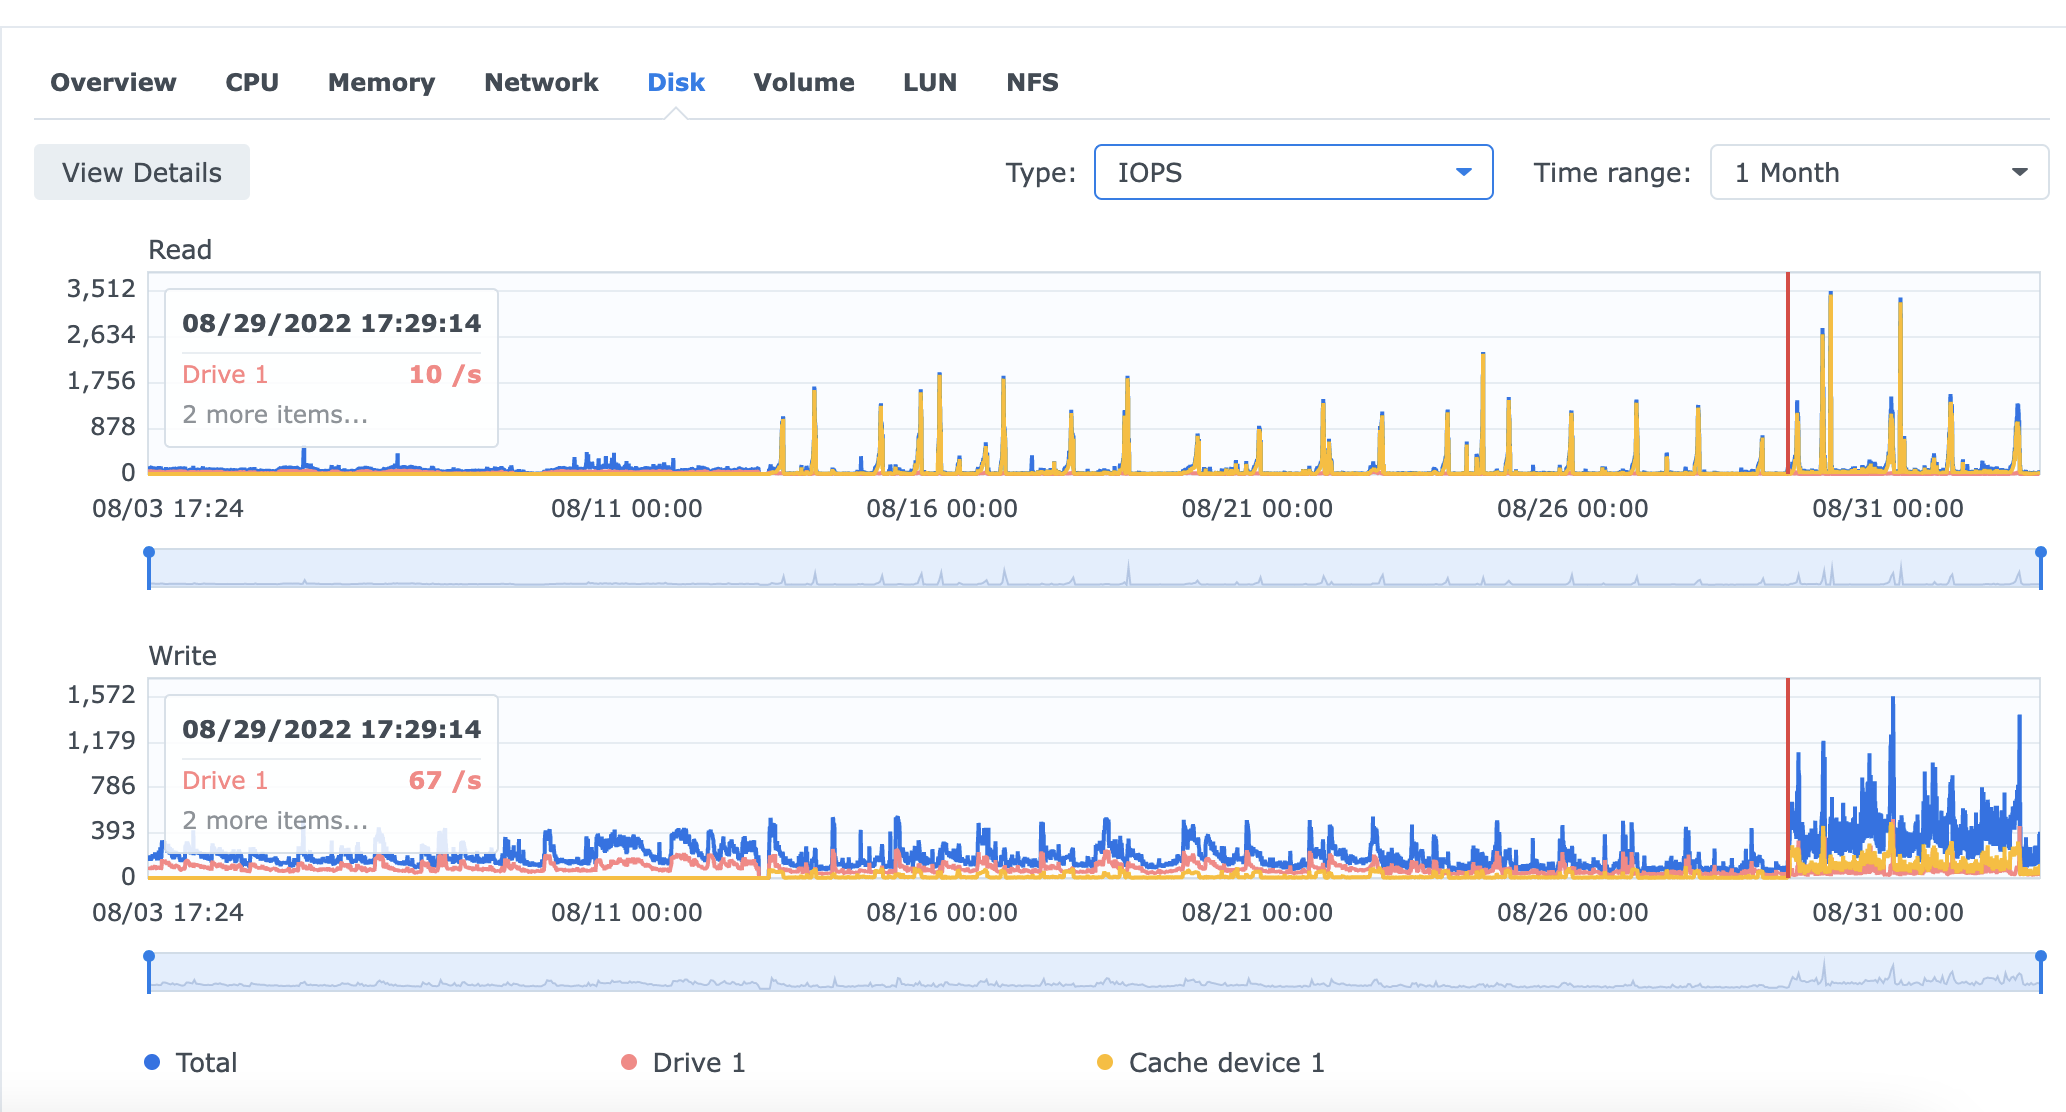
Smarter and juicier interpretations are welcome…
1 Like
This is specifically “system” CPU time, which should be a useful clue. Maybe encryption of the cache drive?… though it wouldn’t take a week, I think. Maybe Synology decided to put additional swap there and some process was using a lot of memory until finally killed on the 19th?
No, cache is not encrypted nor it would take that long to encrypt 100 GB. Maybe it’s some cache related processes synology has come up with while trying to figure out what to do with the added cache. But that wouldn’t explain why it didn’t do the same when I inserted the second nvme (I had to “remove” the RO cache and start the new RW cache from scratch). It could also be some coincidence starting at the 13th and we’re looking at an outlier piece of data. For sure, it wasn’t a scrubbing or a rebuild of a volume…
1 Like
This is the way it has always been…
Apparently, the memory leak was solved in v1.64.1
It now rarely goes over 1GB.
I’m noticing another issue now. I have two nodes on different synos on different IP/24. Node A has 6TB and node B, already vetted on the satellites that matter, with 600GB. That’s 10 times less.
The B node uploads consistently less (but not by much!) than the A node. Maybe the B node is punching above its weight for some lucky reason, but today it’s uploading way more than the A node, which doesn’t make sense to me.
I’ve read somewhere people talking about winning/loosing upload races. How do you check for these? I’m thinking there’s something not going well with my A node…
On another note, I’ve concluded there’s no point in using nvme cache in synos to make your node better. If you mount the cache on the node volume, it will kill your nvme cache in no time. If you mount it on a node DB volume, it doesn’t make much of a difference…
Usually they uses
see also Successrate.sh comparison thread
2 Likes