The past few days I have been working on a storagenode log exporter to extract all possibly useful information like the amount of Errors and amount of Uploads/Downloads/Deletes/Audits (failed, successful, canceled). [This gets stored in prometheus then]
With this information I’m currently creating a grafana dashboard and would like to get your input.
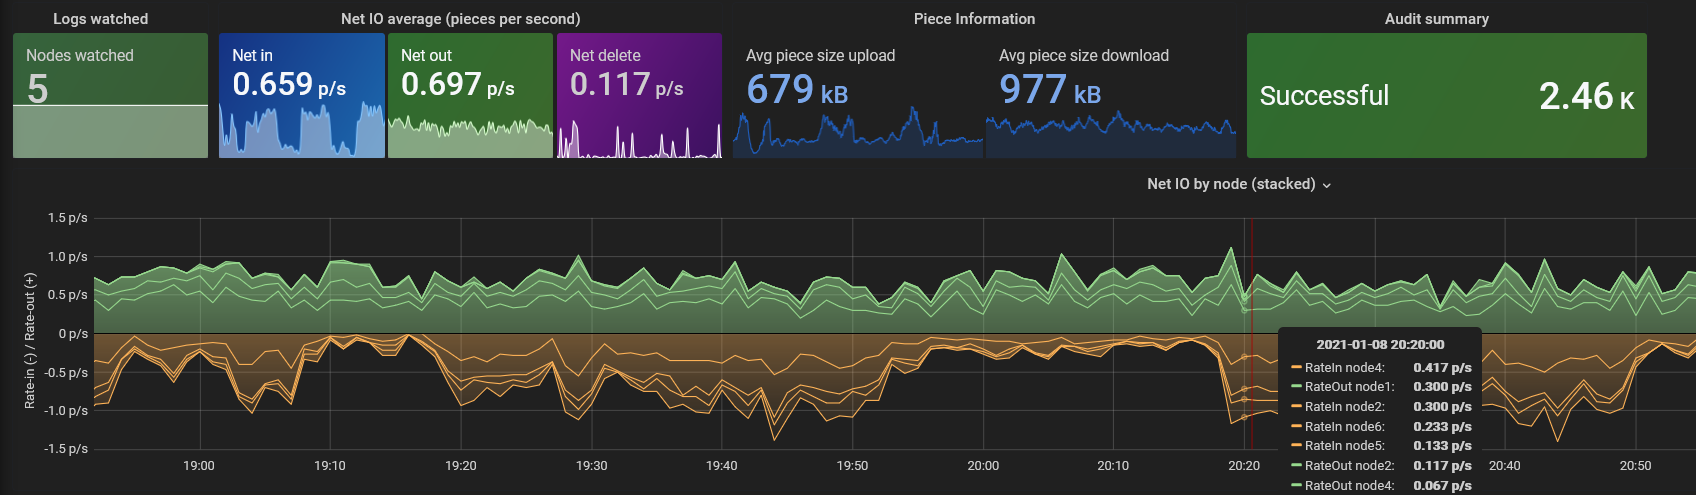
Currently I think I’d like these information to be shown:
All information the successrate.sh script provides (audits, ratio of successful/failed up-/downloads, deletes, etc)
Rate of operations (up-/download, deletes)
Rate of errors and error types
Average pieces sizes (more like a fun metric created by combining log information with storagenode API information)
This is what the dashboard looks like at the moment (there are some metrics missing in the dashboard):
I’d like to hear what you think about the existing part of the dashboard and what metrics you would like to see in the dashboard.
It looks very nice ! Those are the values I would like to keep an eye on as well.
Also successrate.sh calculates the successrate on the whole log which can take some time it the file it big.
Will you make it so that it only “analyses” the last X ours of logs ?
EDIT: wait no if you’re storing them in prometheus you’ll be able to chose X via the grafana dashboard. Consider my question answered (by myself) hahaha
Anyways thanks for all the work you’re putting in !
The exporter will continually pull information from the logfile and it’ll be stored in prometheus.
Grafana then “analyzes” whatever time period you choose in the dashboard. Could be 3h, 6h or 2 days (but I still have to see how well it’ll handle my logrotations every midnight…)
Love the idea. I was thinking in this direction as well but there seemed to be too many moving parts/overhead to put it together. Would be interesting to see how you implemented this.
btw: Do you know how to prevent my metrics to disappear if the query is empty? I tried everything I know and searched the web but couldn’t find anything helpful… my audit queries next to the successful ones disappear because there is no data… but I’d like them to be 0…
@greener Since you profile is hidden, I can’t send you a PM: Do you know how to make calculations with empty queries in grafana? Like I want to calculate the successrate of audits: audits_success/(audits_success+audits_failed)
[I know I can actually calculate this by audits_success/download_started(type=“audit”) but just for example.]
But if one of those queries is empty (e.g. because there are no failed audits), the whole metric is N/A even though it should be 100% in this case and I want to empty query to be just 0 so I can calculate.
If I understand this correctly then if one of those metrics is not available then the whole expression fails. You have functions and operators in Prometheus and it doesn’t seem to allow passing a default value if metric is missing. This should really be addressed on exporter end.
There’s this workaround that you can try to pass a value if expression fails - <exression> OR on() vector(100) but not sure it will do what you need.
Not sure how you would address this, you can’t force the exporter to have a metric available for download_failed{type=“audit”}. If there are no such entries during the given time frame, the query will run empty…
You’re a genius This worked like charm! If the query is empty, it’ll give me 100. Thanks a lot! That solves my problem.
It looks pretty nice! Are you going to fork the existing dashboard and provide a Guide how to setup once done? I would be interested to use it as well, as for now i do not monitoring the Logfiles (yet).
I will provide a guide once it’s done and extend my existing how-to monitor your node.
For now it will be a separate dashboard but in the long run I will try to integrate it with the existing dashboard so that the most useful metrics are combined into one dashboard. I don’t want to have to check 2 dashboards all the time
true but I can work around that if the calculation relies on one metric being available, e.g. successful audits. If that query fails, so can the displayed metric.
I think I’m done so far, unless anyone can think of a missing metric.
I didn’t add every output of successrate.sh script because the audit percentage is irrelevant because you should check the audit score, so I only included the absolute number of audits.
The Error Count excludes falsely classified errors (e.g. shutdown of runner, download/upload failed due to client side errors, graceful exit errors if you GE’ed on stefan-benten).
Let me know if you miss something, otherwise I should be able to publish everything in the next few days.
A combined dashboard with the storj-exporter metrics is on my to-do-list but will likely take a few weeks.

