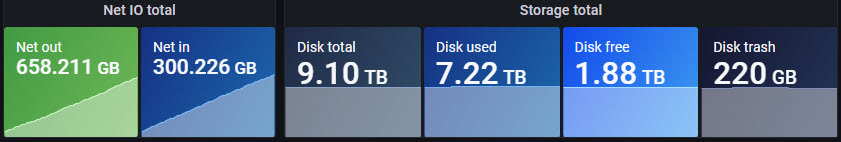
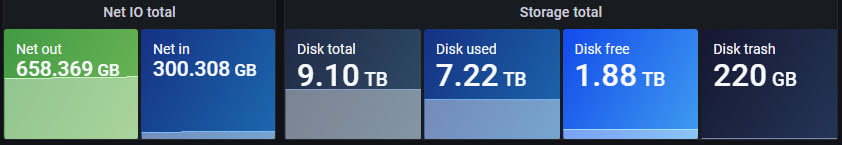
That’s what I use to get the storage increase of the past 24 hours.
It’s a moving average and doesn’t start at midnight. You can do the same for the last month if you replace the 24h.
(I even added a panel displaying the ingress in the past 24 hours per node to quickly check if someone hopped onto my subnet )
Grafana has been updated to V8.0.0 today and this breaks the dashboard.
Plugins seems now to need a ‘Signature’ for better security, the ‘Boomtable’ Plugin V1.3.0 doesn’t have such a signature and is therefore not loaded.
The current V1.4.1 is signed, but doesn’t play well with the dashboard.
Solution:
Edit /etc/grafana/grafana.ini
Add the following line to the section [plugins](Last section at the end of the file in my .ini file): allow_loading_unsigned_plugins = yesoreyeram-boomtable-panel
And restart Grafana systemctl restart grafana-server(On systems with newer systemd)
or service grafana-server restart(On systems with older init.d)
Now the unsigned Boomtable Plugin will be loaded again.
It is if you delete the data manually in prometheus. But you just need to wait until the old node goes out of the timeframe of your dashboard then it will vanish by itself.
BTW: If you followed my guide, your nodes should have names and not IPs. Then changing an IP wouldn’t affect your data/dashboard at all.
Hi guys I’m not sure if anyone has asked this but is there a way to get retained amount displayed on dashboard as I use L1 payout method I need a few months occasionally for minimum threshold to be reached
I’m still on 7.5.7 for grafana…haven’t found the need to update since I know this version works and don’t really want to spend the time dealing with any issues that come along with new versions.
Is there a way to password protect or otherwise secure the data that the exporter opens up to the web?
I have several nodes running remotely,
and I’d rather not have stuff like node-id, wallet address, etc, publicly accessible.
Minimizing attack vectors and all that.
 )
)