Good points. You can raise bugs on the repository (or even better raise Pull Requests )
About uptime: There was no point in “correcting” this after the initial uptime method failed and got removed. And there is still no point in “fixing” it until the new uptime system is implemented.
Do Prometheus, Exporter and Grafana run on the same system or on different ones?
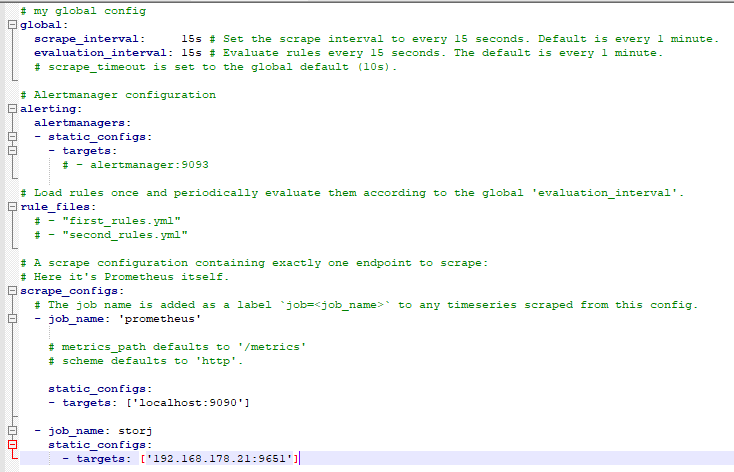
Do you have updated your prometheus.yml?
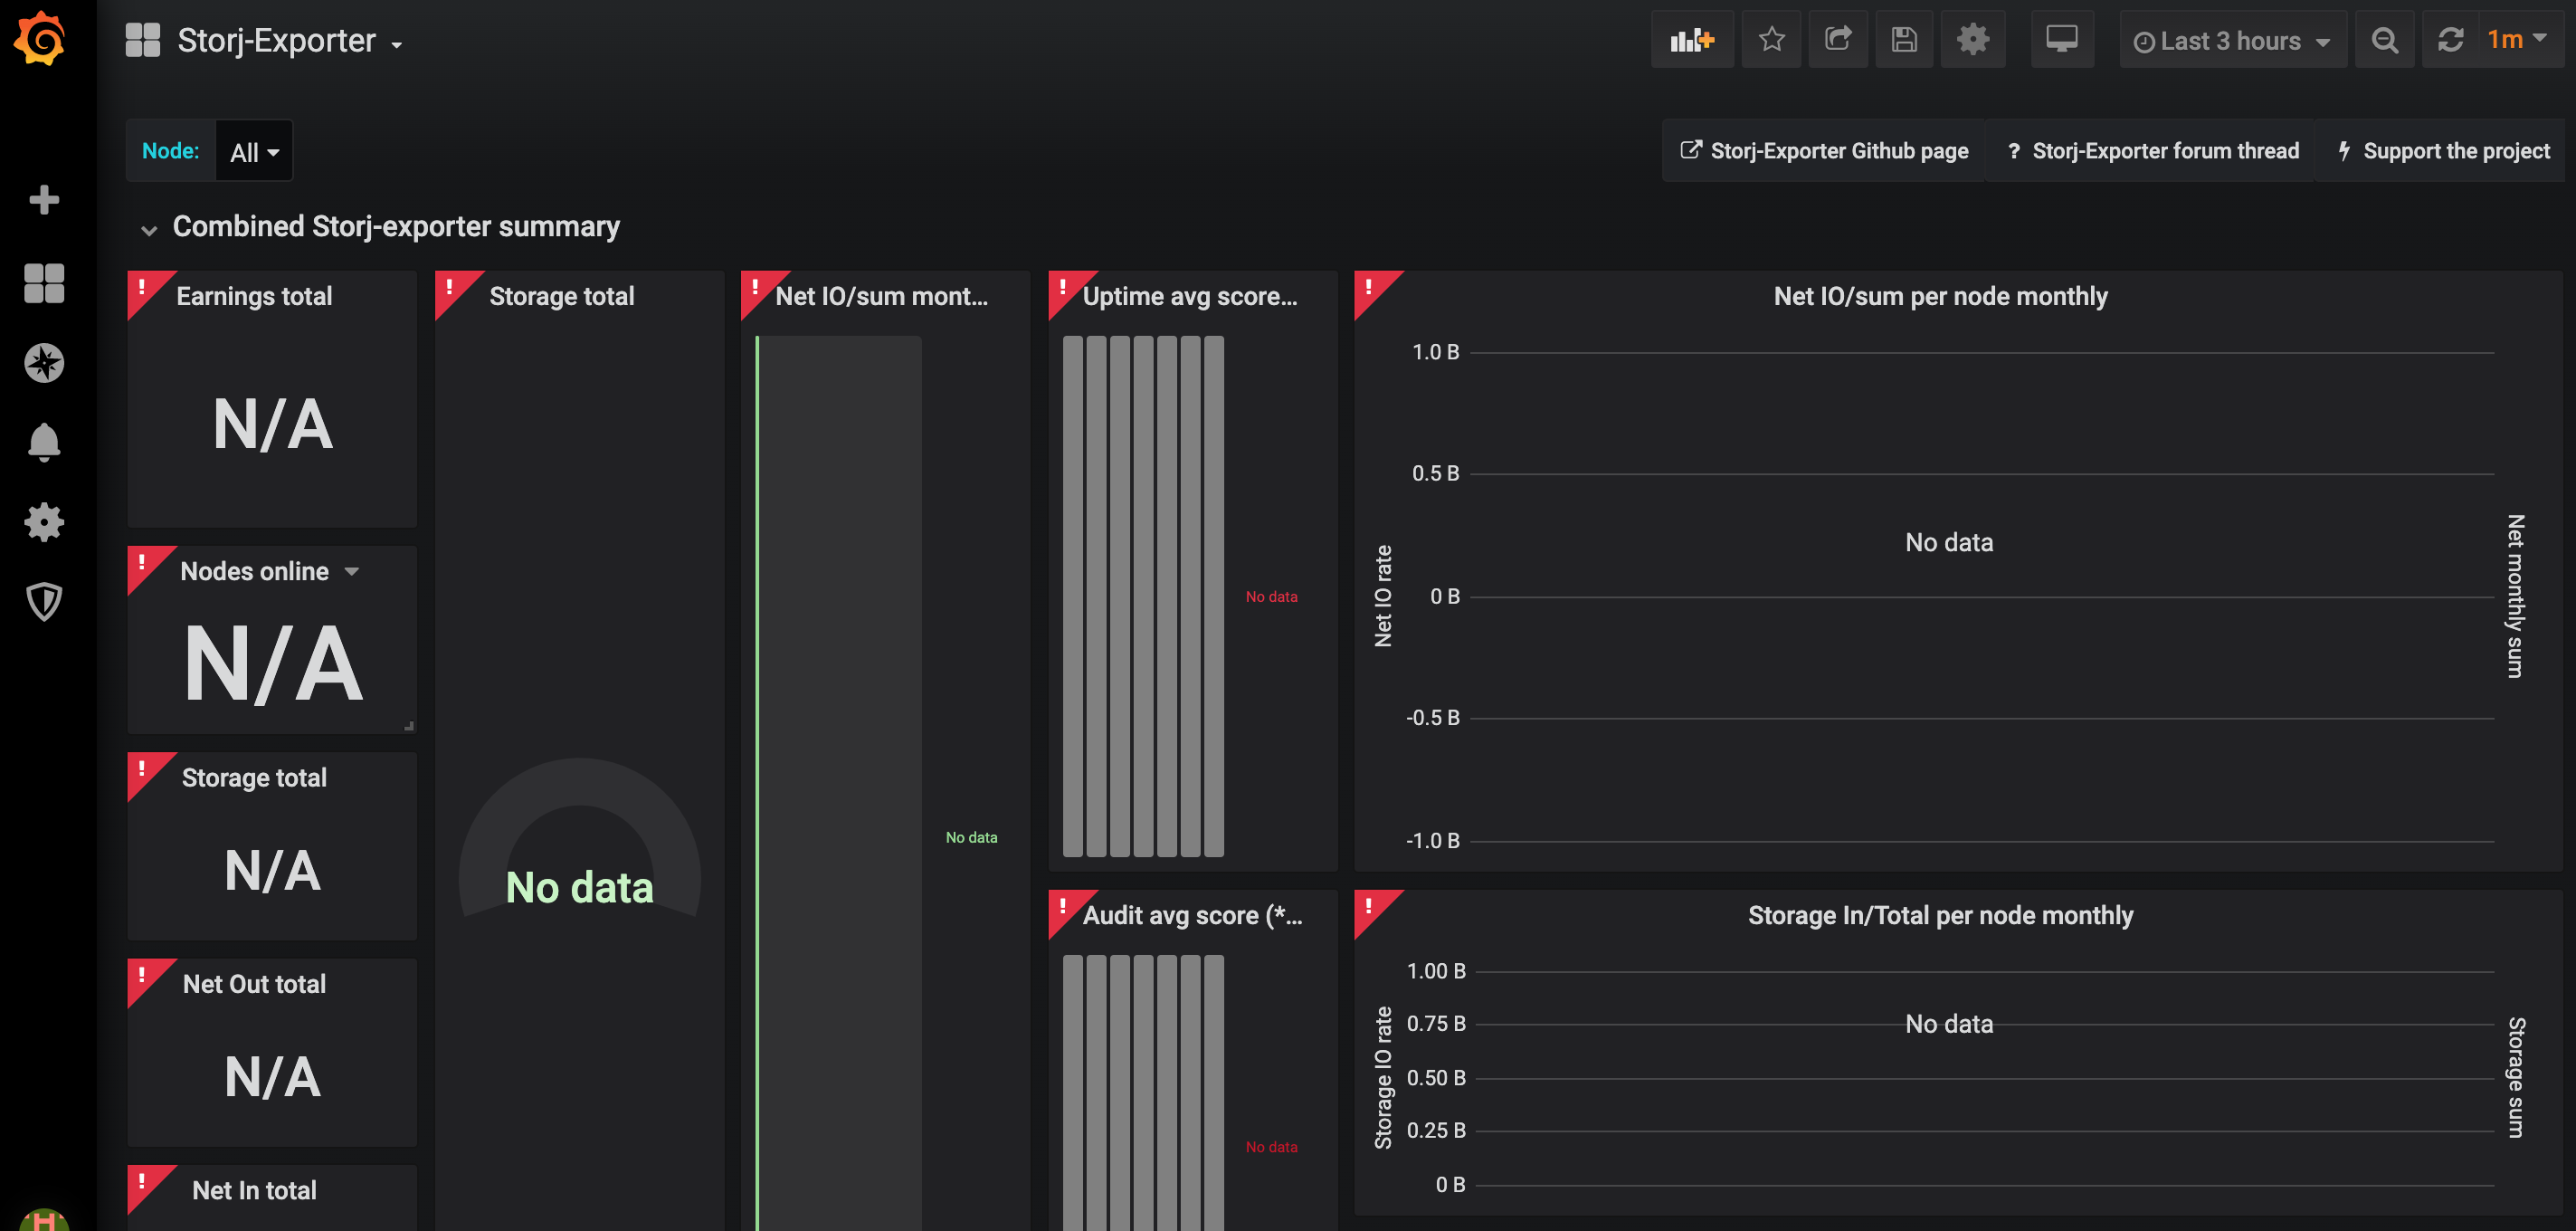
Mine looks like this because I have the exporter on a different system running:
So the new update had an API change that makes the exporter fail…
Traceback (most recent call last):
  File "./storj-exporter.py", line 128, in <module>
    REGISTRY.register(StorjCollector())
  File "/usr/local/lib/python3.7/site-packages/prometheus_client/registry.py", line 24, in register
    names = self._get_names(collector)
  File "/usr/local/lib/python3.7/site-packages/prometheus_client/registry.py", line 64, in _get_names
    for metric in desc_func():
  File "./storj-exporter.py", line 62, in collect
    value = str(self.data[key])
yError: 'lastPingFromID'
Depending on how you run watchtower it may require running it manually to update the image. In my case I had to add --include-stopped flag as seems it wouldn’t pick up the container in restarting state.
Use the following to run it once:
I also merged latest commits to dev that also includes removing some deprecated metrics. Looks like one is still used in Disk used tile on node details on the grafana dashboard. I’ll update the dashboard repo some time soon.
I still can’t understand, can docker image be used with multiple nodes? I have 7 nodes on my ubuntu server and im using 7 instances of python script i’ve generated for 7 systemd services… Feels wrong. Any guidline how to use it propertly?
Currently that is the only way it would work.
But if you know python, you could “easily” change the script to check all your nodes and expose multiple endpoints to prometheus.
In my opinion, it is however easier (in development) to just have one script check one node. Running multiple instances of that script to check 7 nodes isn’t that big of a deal. And it would be easier if you just run 7 docker containers with that script, then you don’t have to generate systemd services.
U’re right, but only problem i have is updating base python script. It still needs some manipulations before it can be used, then bash scripts do everything i need. That way docker containers looks much greater, but i can’t understand how to start it propertly. For example, sc name is storj5, dashboard is on port 14005 and i wanna start exporter on port 9656. How docker run command should be look like?
There’s no point to run multiple storagenodes on one host and although some do (including me ) I don’t think it would make sense to extend single exporter instance to support multiple nodes. It’s sort of against prometheus design I believe.
I find that easiest way to run multiple instances of exporter then is with docker. All you need to do is to use a different external port and name for each instance and point it to the right storage-node. That’s about it as far as I remember.
Say you have second storage node container running as storagenode-2 and you want exporter to run on port 9652 (port 9651 is occupied by the exporter for storagenode), the command would be:
You can test if it works with curl http://127.0.0.1:9652/metrics. If it returns a bunch of metrics you should be all set to point your prometheus at port 9652 for storagenode-2.
@greener, I’ve made a slight modification to the Boom Table dashboard and issued a pull request for your consideration. For the disk space used panel on the per-node details, it seems as though the storj_diskSpace_used{instance=~"$node.*"} target no longer has data, so I’ve modified that to storj_total_diskspace{,type="used",instance=~"$node.*"} instead.
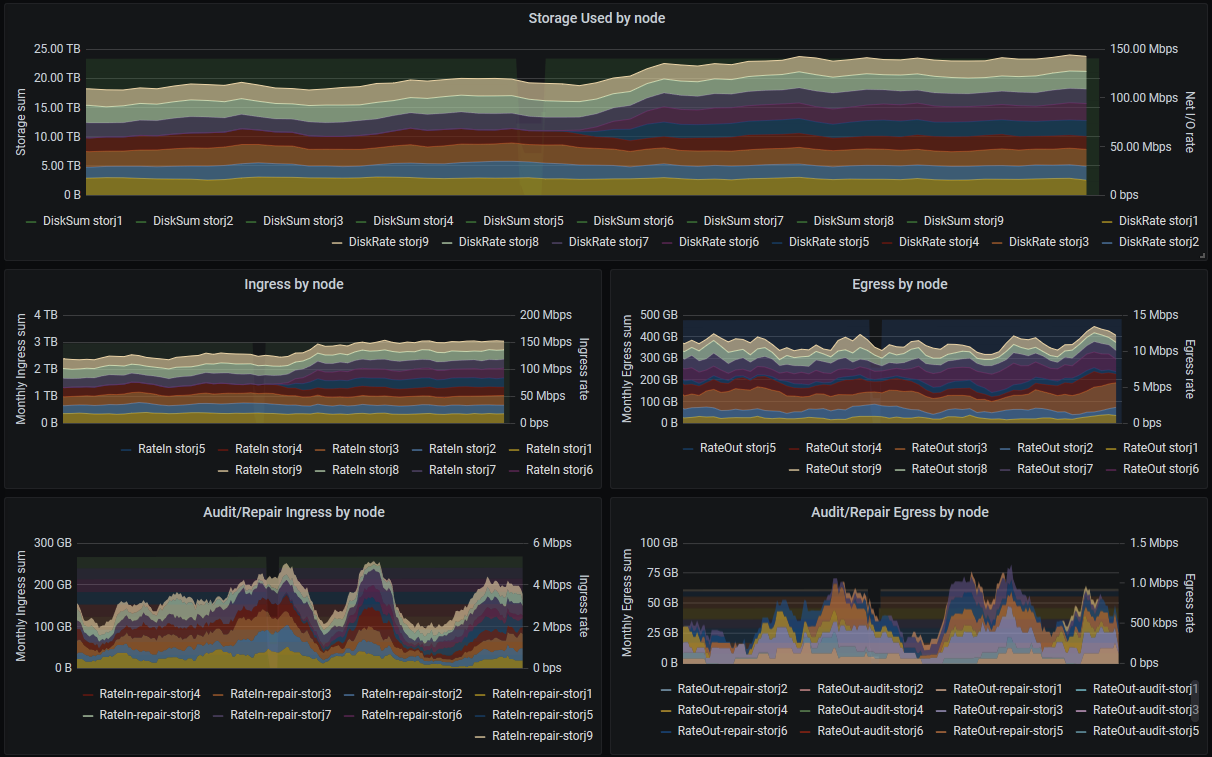
I’ve also included for consideration an alternate Boom Table dashboard that splits out the ingress and egress graphs to be more easily readable. It works better for me as I have 9 nodes so it’s easier to follow the data.
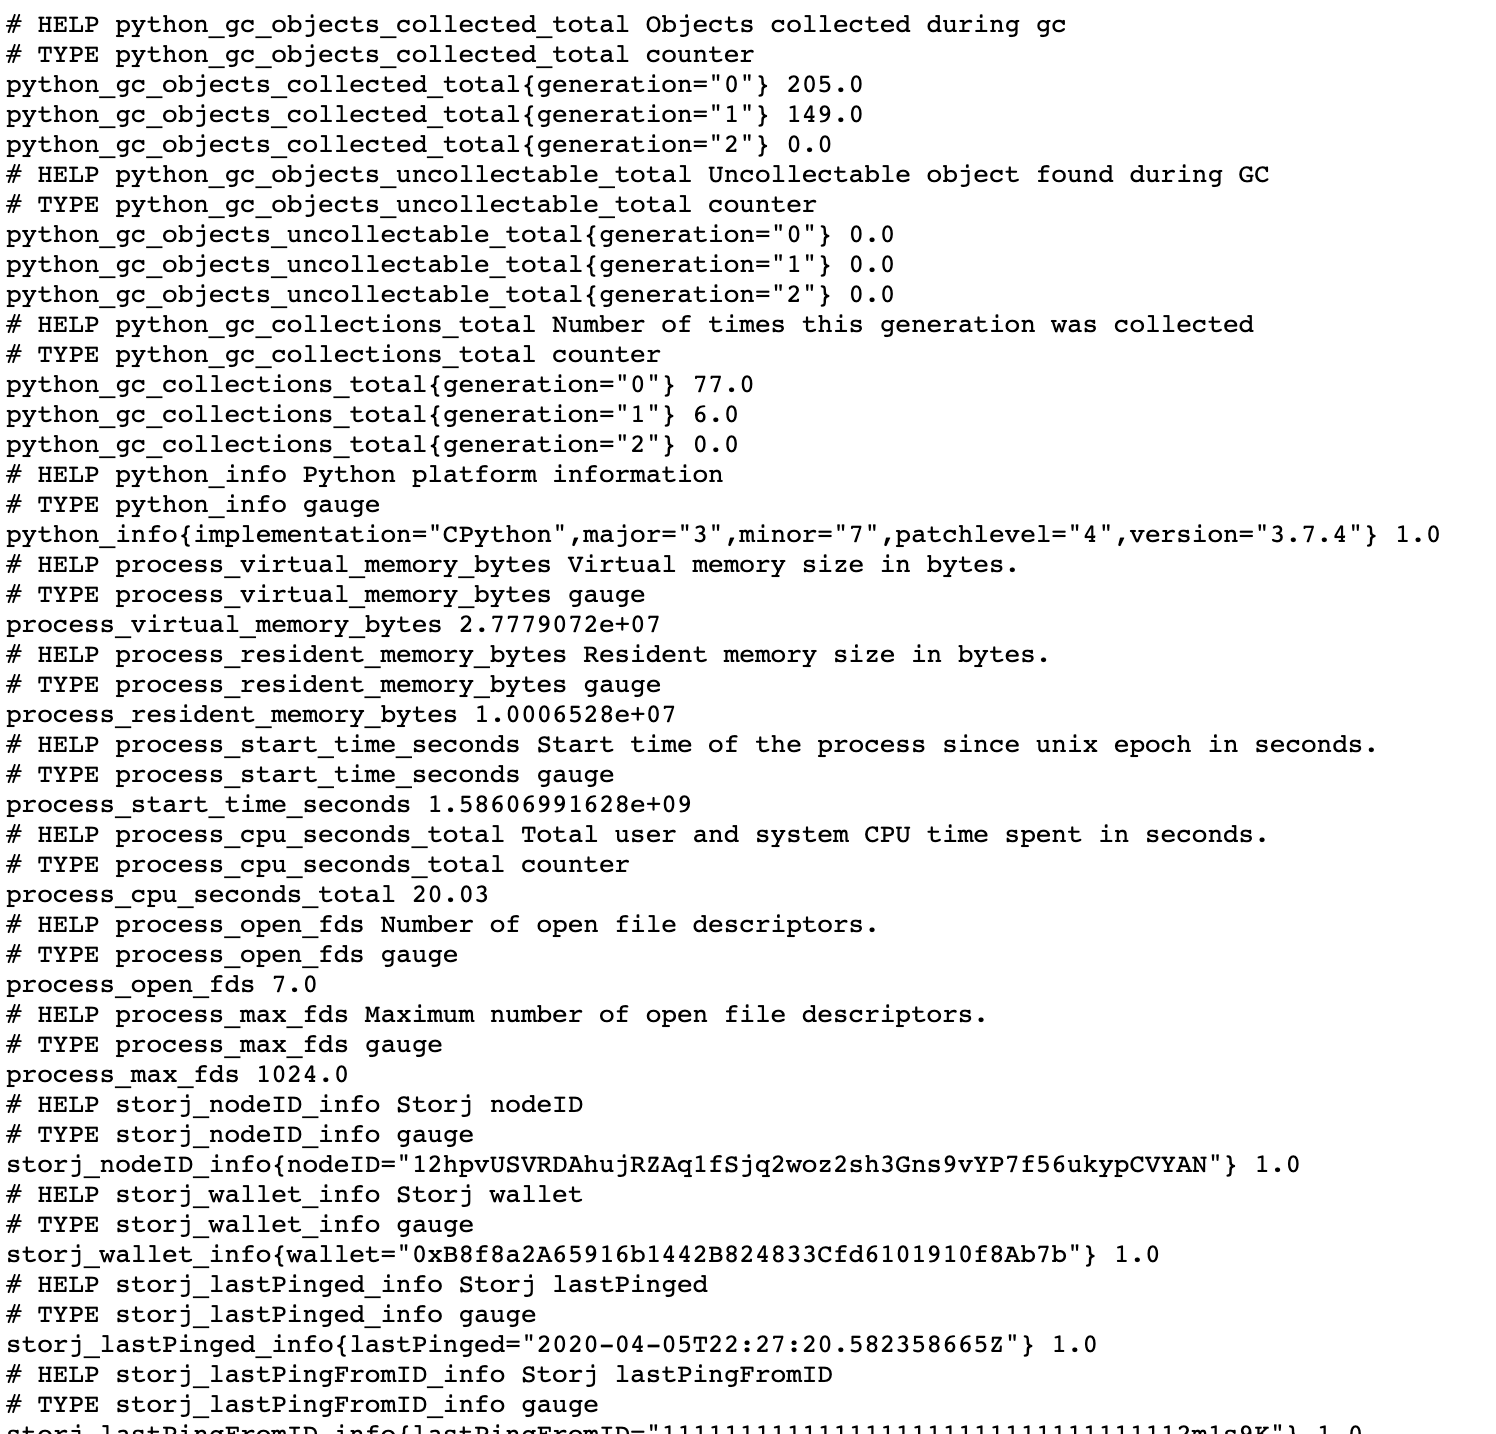
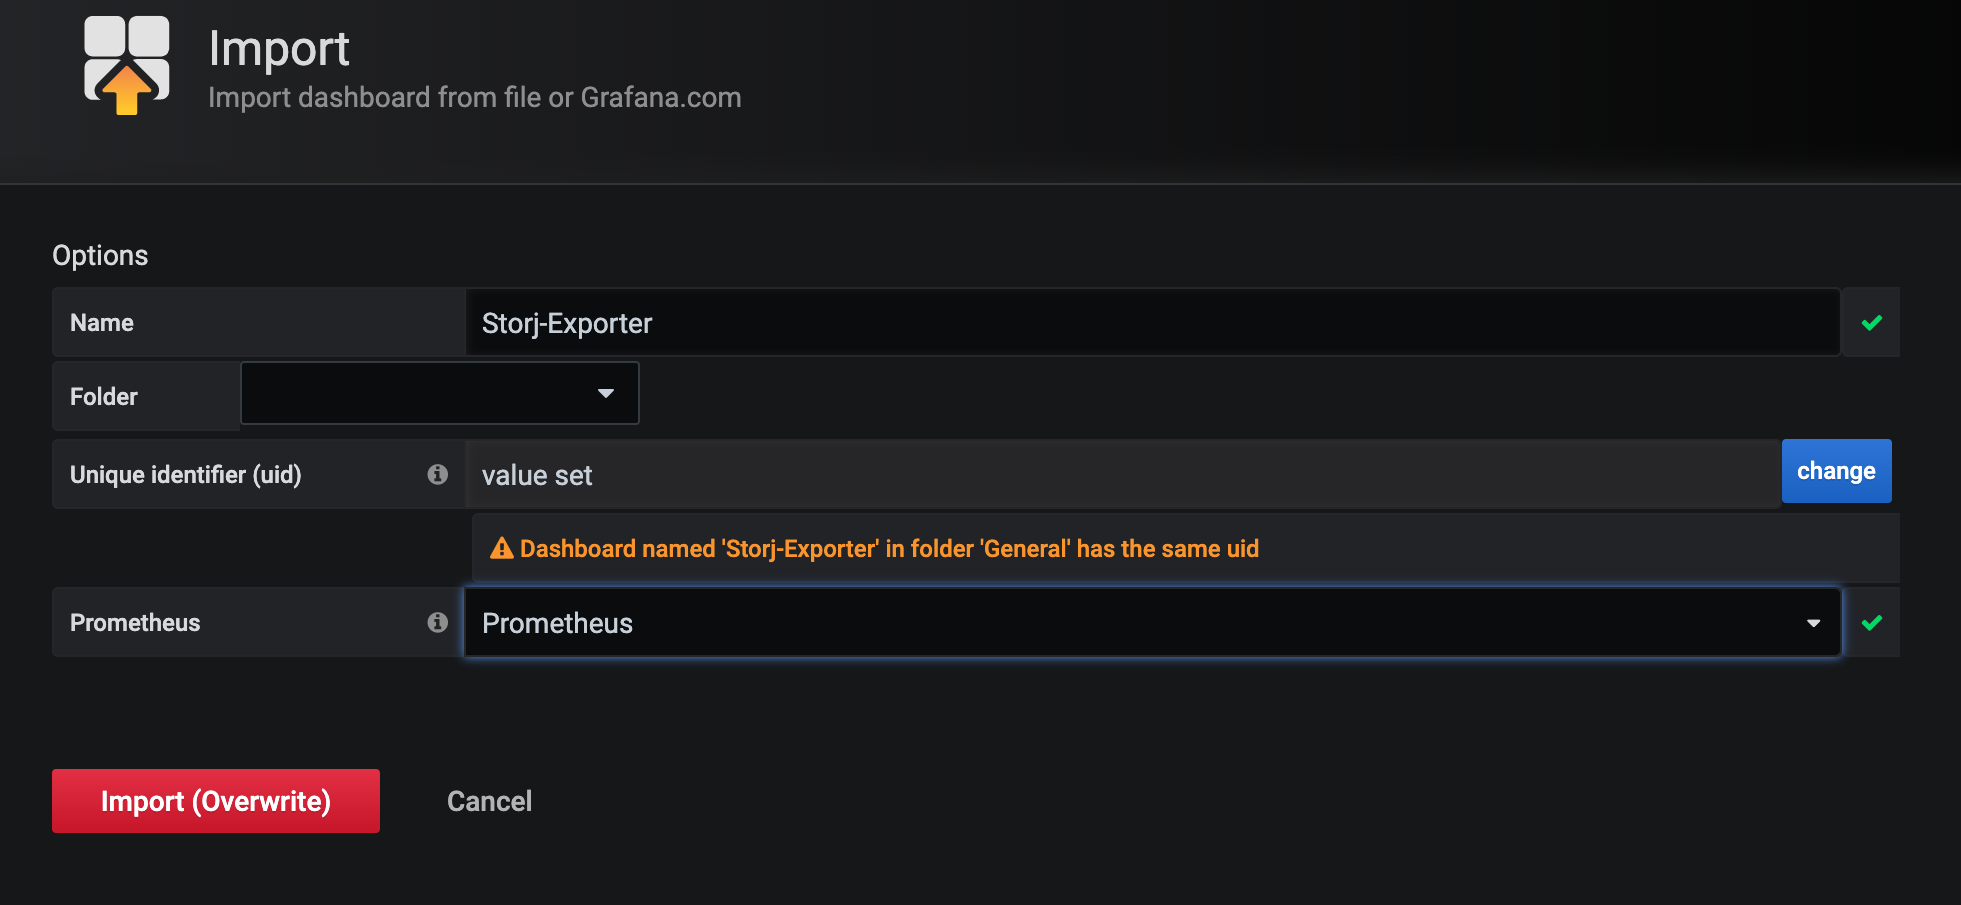
I installed a Storj-Exporter docker and I can go to http://IP:9651 and see the metrics
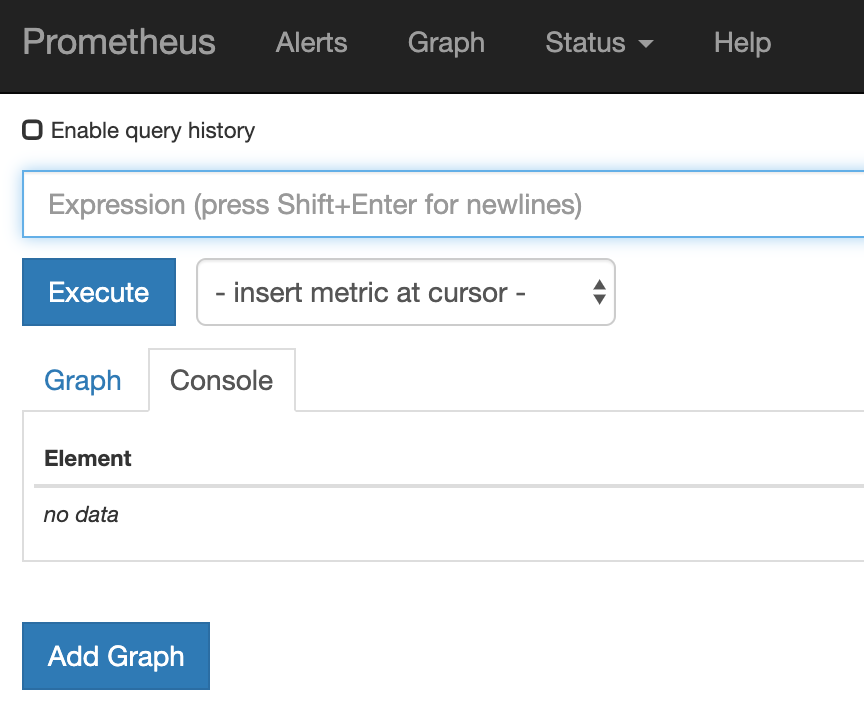
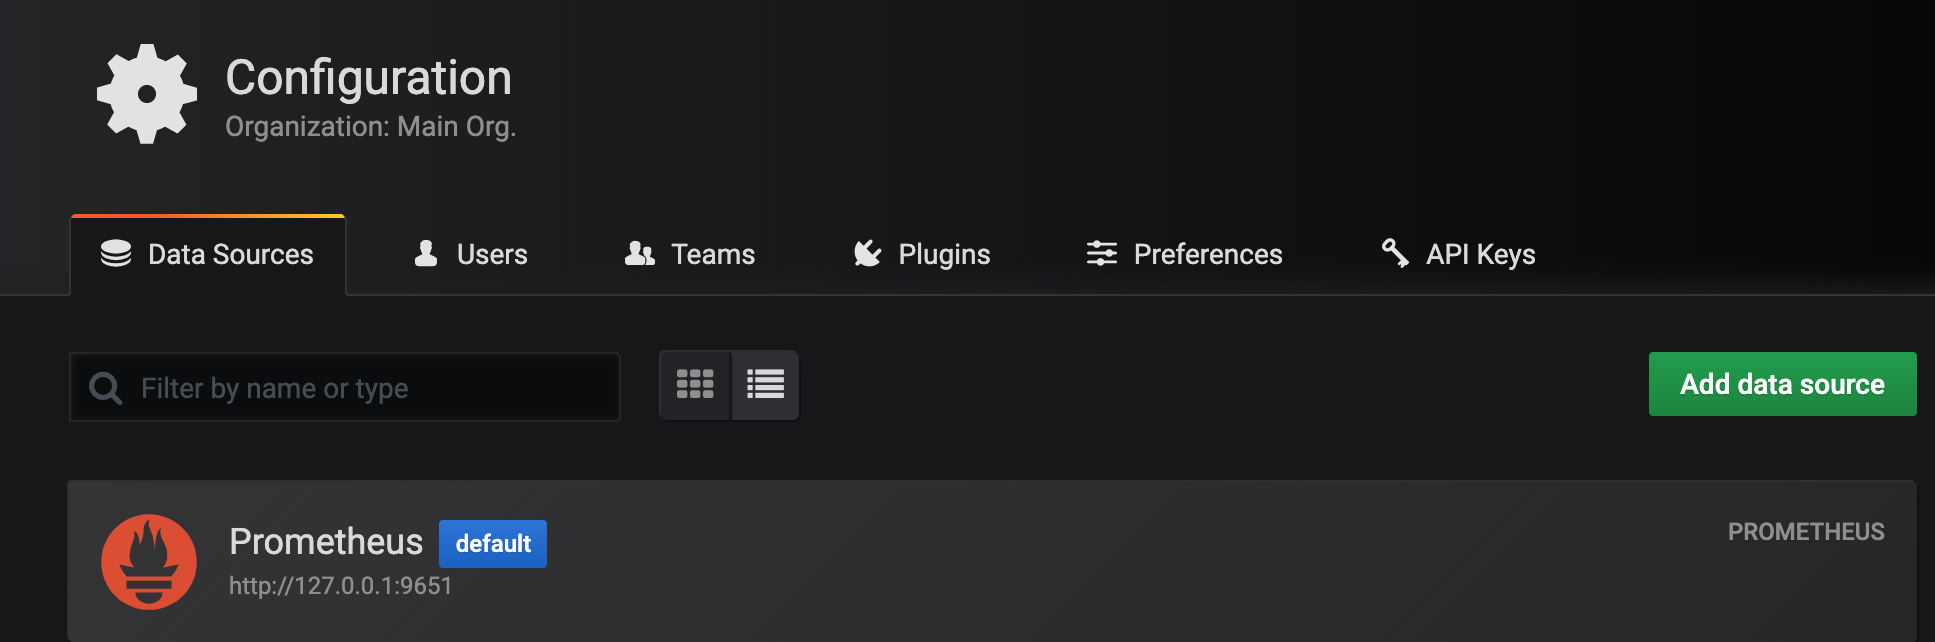
I installed a Grafana docker, setup a Prometeus data source with:
URL “http://IP:9651”
Default flag: Disabled
Scrape interval: 60s
Query timeout: 30s
HTTP Method: GET