At this moment we have 3 days with 0 payment! Or the manual “how to save 10%” for storjlabs

3 Likes
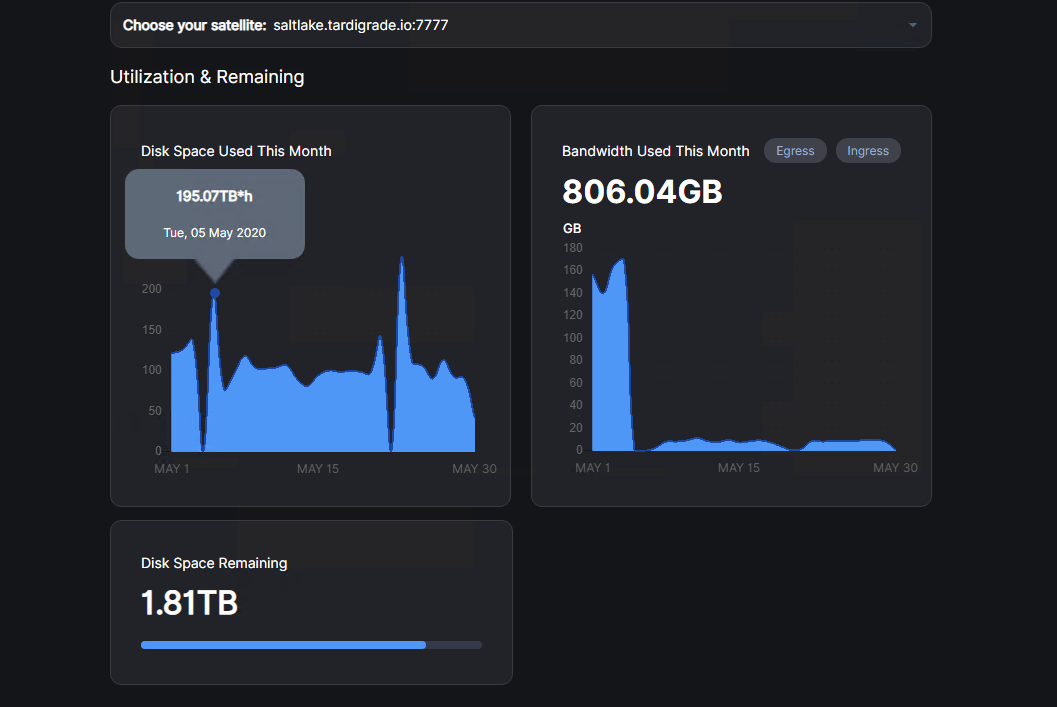
Super slow ![]()
25 days and still not completed
I see the samething but there not cheating because you see a spike in data the next day,.
2 Likes


1 Like
No we can’t because your node is probably close to full so its not reciving any more data.
This is my full node

How should this affect it? The data is already loaded, BUT NOT INCLUDED!
You literally quoted someone from Storj telling you this does not impact your earnings. So no, it’s not even close to cheating. It will be compensated, there is just a delay. I pointed out a similar issue in payouts and they immediately acknowledged it and explained it would be paid out next time. There hasn’t been a single case of Storjlabs not paying what SNOs are owed and if you have any evidence otherwise, bring it. Otherwise please refrain from baseless claims and focus on the issue in reporting, which is all this is. And you know it.
Your entire post is disingenuous. So I won’t engage any further. Have a nice day.
8 Likes
What can we trust? Where is the correct information for which we can control payments? The words of command? API? Now I have shown the output from the API and I was called a liar and a hypocrite for this post.
I appreciate you changing the wording in the topic title. If I have some time tomorrow I can have a look at what’s in the node databases. You can of course also monitor the blobs folder yourself to see how much data it holds for each satellite and compare the totals. Before I get the chance to take a look at that I’ll refrain from speculating. But I’ll report back if I find anything interesting.
via @zeebo:
I’m sorry about all the confusion about payments. Getting this right is very important to building a healthy relationship with node operators and so I’m going to try my best to explain what’s going on and how we’re working to fix it. I’ll try to explain the problem that we’re trying to solve, the current architecture we’re using to solve it, the problems with the implementation, our current workarounds for those problems, and finally things we’re doing in the future to fix the architecture.
To start, the problem we’re trying to solve is compensating storage node operators for the amount of space and bandwidth they are using in a way such that they cannot cheat and get extra, while ensuring that they are incentivized to stay online to maximize their earnings. For example, because a single bad actor could sign up and exploit any issues with this accounting, we can’t do the obvious and simple thing like just have the nodes report the amounts they earned and trust it.
Next, I’ll describe how we’re solving the problem. Bandwidth and storage accounting are two separate systems. I’ll start by explaining storage accounting. Each satellite contains a large database with an entry for each file stored in the network. That entry contains which storage nodes are storing the data and how much data is on each node. Since we pay for byte*hours of data stored on the network, we periodically walk the entire database and try to get an estimate of how much storage is used on that node at that instant in time, and then multiply that by the number of hours since the last full walk. Bandwidth accounting is done during an upload or download operation initiated by an uplink. The satellite returns a list of nodes for the operation as well as signed order limits. These order limits contain which node it is for, the type of operation, etc. The uplink then signs the amount of bandwidth it uses with the order limit and provides that to the nodes. Eventually, the nodes submit these order limits back to the satellite. A process then batches up these order limits, removes any that have already been processed before, and increments counters for the nodes for how much bandwidth they’ve used.
Next, the problems with our implementation. Fundamentally, they both come down to scaling the database to be fast enough. For example, if it takes over 24 hours to look at every file in the database, you won’t have any entries for how many byte hours have been used for that day. This explains the spikyness in those graphs: the amount of time it takes to walk the database and when that happens will cause the data points to have more or less byte*hours, but it will be correct on average because we look at how long it was since the last walk, rather than expect it to happen on a tight schedule. And for the bandwidth, if we cannot consume the queue faster than entries are being added to it, we’ll have an increasing backlog of entries forever. That’s what’s been happening.
Our current workarounds involve tuning the database and queries used in these systems to be as fast as possible, tuning the sizes of the batches we operate on, etc. Some of the tuning takes longer to perform, such as changing where and how the database is hosted. Because changing where it is hosted is a large risky thing to do, and as long as we don’t lose the submitted orders, they will be paid out eventually, we’ve waited to do it until other less risky measures were explored. We’ve recently switched how it is hosted for the saltlake satellite, and with some final tuning to the query and batch sizes, I expect we’ll be able to get though the (substantial) backlog quickly.
As for why you see no bandwidth instead of a slow but low trickle of bandwidth is due to an unforseen detail of the way the orders are consumed. Because we may eventually use CockroachDB for this database, to aid in the transition, the schema was designed with CockroachDB in mind. Specifically, because it is built on RocksDB, it has a feature called “prefix compression”. That means that if you have a primary key for some row such that prefixes of the primary key are often the same, you get space savings. And so the schema places the node id at the start of the primary key so that they are compressed “for free”. Unfortunately, this has the side effect of making it so that nodes with earlier ids are processed first, and if the queue is growing faster than we can consume it, they end up being the only ones processed.
Finally, as for what we’re doing to fix this in the future, we’re designing and building a way of avoiding double spends by keeping track of which orders have been spent inside of a Sparse Merkle Tree. The blueprint is at https://review.dev.storj.io/c/storj/storj/+/1732. This will allow us to avoid doing more than a single read/write to the database when processing a batch of orders and will allow us to avoid storing more than a single hash to prevent double spends. Currently, our database in terms of size (and probably IOPS) is 99% handling the orders, so it is expected to be a massive win and will prevent issues like this from ever happening again. Additionally, I’m going to be adding metrics in to the system that will allow us to easily ensure we’re making speedy progress on these critical systems.
I hope the above explanation helps provide more context for the issue and helps regain some of the trust that has been lost. I’m working over this weekend to get all of the backlog orders processed for this next billing cycle, and will do whatever it takes to make sure that happens.
Thanks.
13 Likes
Nice explanation.
But if the system struggles at a few peta bytes how will it work at 100 petabytes? Does it need to scale out instead?
Great explanation, thank you!
And as for me It would be extremely interesting to know the size of the database and the storage period of the orders.
1 Like
Why is this neccessary?
Is it not possible to (additionally) keep a single record per node of the current used space which gets updated with each upload/delete instead of walking through all files every day?
I think there might be a problem with database locks. It is also important to know history.
Such a system is almost guaranteed to get out of sync at some point. It wouldn’t be reliable enough and additionally it would put an extra database transaction into every order. So that could just move the problem to a different place.
Currently, the database is in the single digit TB range, with the largest non-order related table in the single digit GB range. We store the orders until they are processed, and we store the fact that it has been processed until the order expires.
3 Likes
@BrightSilence already did a good job explaining why we wouldn’t want to rely solely on a system like that for correctness. Even if we did that, we’d need some process to walk the whole thing to ensure it went back in sync, anyway, so we’re using that for now. Additionally, we already walk the whole thing to check for values that need repairs and to collect samples for audits, so piggybacking on that system was a good tradeoff.
That said, we can do something like a hybrid approach where we keep a running total that we add and subtract from and only write the delta to the database when it’s either large enough to be relevant or stale enough, and use the periodic walk to get a true value. It would be even better if we could do the walk as a batch job in the background operating on database backup/snapshots so that we can more easily scale it and backfill data if there’s unexpected delays.
If I individually had to design the system right now, something like that is probably what I’d move towards.
6 Likes
Thanks for the detailed answer!