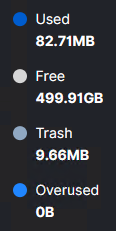
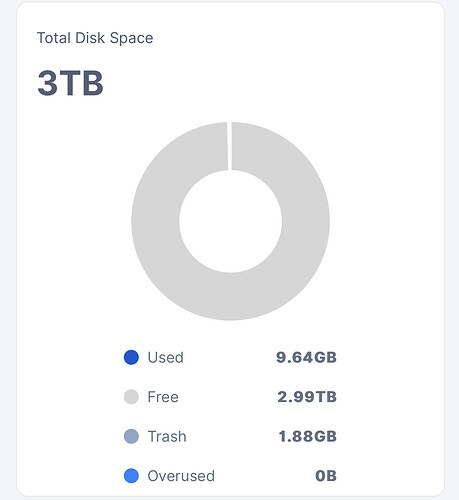
Someone see any decadency in this graphs?
34.31 GB egress. Cool. ![]()
A few days ago, I noticed that only about half of the ingress remains on storage, so everything looks normal to me.
Maybe I’m missing something here ![]()
Deletions? Maybe new customer uploaded stuff and then decided to delete it. Would need to investigate logs for that and compare vs end of April.
Though I noticed it too - growth slowed. Maybe it’s due to old data being deleted? Again, would need to check logs and track pieces ![]()
If the data would be deleted it should be in trash, right?
All Sattelites are pretty stable with disk space used.
I have very few canceled downloads, so that’s not it either.
But what happens if pieces are downloaded to the nodes and the upload from customers gets aborted?
Graph doesnt make alot of sense to me. From Empty to getting ingress again? Doesnt seem right either…I supose you ran a GE and got free space. So getting ingress again.
The Graph that @Vadim is showing is that of a new node. I noticed that if I activate a new node, the input is about 40GB per day or so. As soon as it occurs after two a month or so it collapses to 10gb. As if Storj had made a selection that all new uploads from clients happen on new nodes and not already verified nodes pure having space. I’m not making any other comments because this is what happens. I let you understand what is being done in this period.
Funnily enough I spun a new node yesterday as well.
Clearly the reported bandwidth doesn’t seem to marry up with the used disk space.
I’m not overly bothered about it, personally, but my observations match yours.
Yes my point is that 40GB ingress in a day, but only 1/3 of that go to hdd, deletions was almost nothing. It some kind of not possible that 2/3 traffick go to nowhere.
HDD connected by Sata.
Perhaps it was canceled before finishing. The bandwidth is used, so you can see it on the graph.
You may check this in your logs.
Mine is an SSD over USB3 (temporary thing, don’t judge me!) ![]()
trash is only for pieces that were removed while storage node was offline or too busy to remove. Unlikely for a fresh node. If a node was online while a customer decided to delete the file and the node was not crazy busy, pieces are deleted immediately.
I am seeing the same behavior. I haven’t dug into why but it feels very much like a bug as these numbers are way off from the norm. Maybe it is excessive deleted that don’t go to trash?
it can be also canceled before finish. Please check your logs.
Are these uploads ever finished?
Was this changed? Haven’t seen anything.
And also default config option:
# move pieces to trash upon deletion. Warning: if set to false, you risk disqualification for failed audits if a satellite database is restored from backup.
# pieces.delete-to-trash: true
Indeed, you’re right. I keep forgetting about this change.
Did create a new node and the interface itself is showing considerably less received data than the dashboard, so I would say the dashboard doesn’t show correct values at the moment.
This is with 1.78.2.


But that shows even less than what is stored… which seems unlikely.
No, it’s not because of the cancellation of uploads. This is just another bug in the node software added in one of the previous updates!
Since recently (about a month ago, possibly starting with version 1.75.x or 1.76.x), ingress traffic has simply been counted incorrectly. It is overestimated by 60-100% relative to the real one. Whereas egress traffic as before is counted more or less accurate.
I use third-party software(BWmeter on Win) to calculate traffic on network interface level and previously the stats from it coincided with the readings in the dashboard of the nodes (there were discrepancies, but within about 5% usually). And still match for egress traffic now. But the last month does not coincide at all for incoming traffic - the node software issues clearly inflated values, even exceeding all traffic on the network interface in general (in along with the traffic of all other applications installed on the computer)
For example stats from one of my nodes from start of May (its full node so does not receive much of ingress now), running on ver. 1.76.2:
Node DASHBOARD: 63GB Ingress / 140 GB Egress
BWMeter (filter*): 35 GB download / 144 GB upload
BWMeter (without filters*): 37 GB download / 147 GB upload
Filters mean selection of IP traffic to count selected by Storj node app and local port number used by Storj. Without filters= all internet traffic on this machine regardless of app/port/protocol/etc.


