GC = Garbage Collection
1 Like
The disk is an 8tb shucked wd easy store white labeled nas drive. Its 160w/r about.

Heres data from the disk showing the time when it steadily rose to its maximum right in the middle of the graph. The disk usage doesnt show much. Also i havent changed how the disk is used suddenly 3 days ago and consistently increased the amount I use the disk to cause the weird slope of the cpu usage. Plus the memory usage isnt climbing with the cpu usage or is any higher than it was before this climb. It doesnt seem like those would cause this.

but your memory usage is all over the place… that what really gets to me… your memory usage goes from 100MB or less really to basically 1GB over a period of less than 24 hours
and your disk being white label kinda excludes your ability to confidently say its not a SMR drive.

this is what my 3.6TB node looks like max graph for 24 hours, which means if it was unstable it would move, but it doesn’t … that is how these graphs should look if your setup didn’t have issues, i can set it to 1 core and 512MB memory and run it for a week without issue, so long as my storage behaves…
it’s always the storage that causes issues and i would say yours is most likely an SMR
and in regard to the first graph your shared, MB/s isn’t iops…
doesn’t have to have anything change except the ingress and egress of the node.
garbage collection like little skunk suggested, or restarting the node (which starts filewalking) or the HDD just misbehaving.
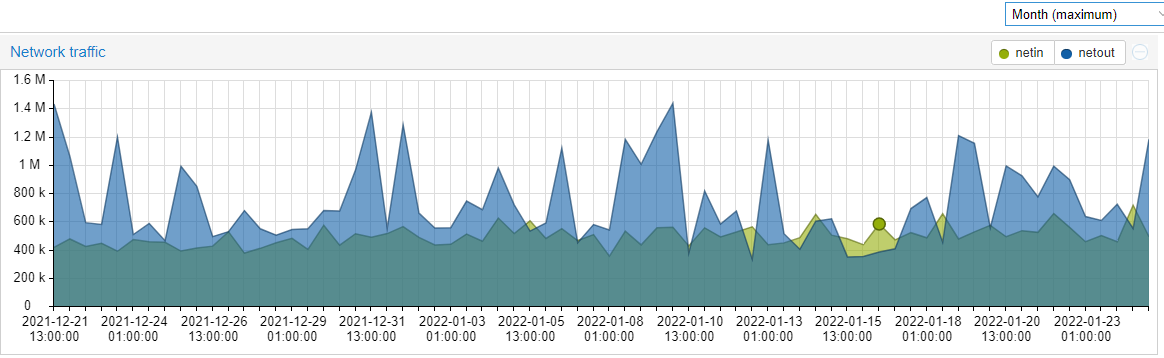
monthly max for the same node, bandwidth usage in MB/s, and like your memory graph, its also all over the place… i know this is on a much longer time frame, but it shows just how wide the gap can be, which would mean your disk might be good one day or for some hours and then not during others.
also another thing to keep in mind is that memory usage when dropping drops slowly… if you have a node using many GB of RAM and the issue is corrected, it will take many hours if not a day before usage / allocated memory goes back to normal.
and on top of that, restarting the node to try and fix high memory usage generally would only make it worse, because if your disk couldn’t keep up, you would just be adding the intensive filewalking process on top of its already to extensive workload.
i think you, might need to try and limit your max concurrent to get an idea of if it’s your disk that is causing the issues.
I moved the node overnight to a red labeled drive that I have and its having the exact same issues. Exact same consistent slope of increase. Are there logs i can provide that would shed light on this? Would I see a ton of failures if the disk was unable to keep up? The upload has a 98% success rate. I just dont see how something hardware would cause such a sudden and consistent issue like this. I feel like if the disk was the problem this would have started slowly as the node size increase as opposed to suddenly starting the slope at 01/21 12:00. Also when the slope got really high the first time the IOWait actually dropped slightly. And it averaged around 5%.
Thanks for the assistance! I really appreciate it. Ill try any suggestions!
1 Like
Also Ive done a touch of looking and it seems like WDs SMR drives only go up to 6TB. Nothing over 6TB is SMR from what I can find.
Ive limited the concurrent requests to 4 (not sure what is a good number, just figured Id set it low to try to see a difference) and will let it run on the red drive for some hours to see if it increases.
No number is a good number. At best you can pick a less bad number. Your node shouldn’t be rejecting transfers unless absolutely necessary. Please disable this option after testing.
If this does help and you see a lot of rejected records, something bad is going on that should be fixed rather than worked around. Please let us know your results.
It may be worth stopping your node and checking the integrity of your db’s as well, as this could possibly contribute to hanging transfers. https://support.storj.io/hc/en-us/articles/360029309111-How-to-fix-a-database-disk-image-is-malformed- << do this until step 5.1 to find the integrity of your node db’s.
On windows PC I usualy used to have 0.1-2% cpu per node. most time 0.1-1%.
I have I3-I5 CPU-d. Windows based. I think this rise of cpu usage is docker problem, as it also mooving data from OS to inside docker app. As last week rised Egres and Ingres Ammount.
This is the output:
./orders.dbok
./notifications.dbok
./storage_usage.dbok
./heldamount.dbok
./info.dbok
./reputation.dbok
./satellites.dbok
./piece_expiration.dbok
./secret.dbok
./pieceinfo.dbok
./pricing.dbok
./used_serial.dbok
./bandwidth.dbok
./piece_spaced_used.dbok
I assume thats the “No errors” output. So we should be good there. It looks like it takes 2 hours for this slope to be noticeable so ill have to wait to see if the concurrent limit has an effect.
I can already see it rising. Limiting it to 4 hasnt stopped it and I can see in the logs that its refusing excess. So its not the upload. Unless I need to limit it to 1 to fully rule out reading. I could also disconnect the node from the satellite and see if it increases then.
Wouldnt I have seen this rise before if it was because its containerized? Also the egress and ingress are inconsistent and psuedo-random. Would that cause the stick straight slope I see? Its almost like a memory leak but for cpu. And the logs just show the node doing its normal upload/download/trash stuff just like it used to. And my success rates havent changed.
may be it because you limited connections? People want to use your data but they cant. Also is it posible Ddos atack to you?
Ive only limited the connections for less than an hour this morning. Its been unlimited for 10 months now. A DDOS is possible. Not sure how I would go about testing that. I have the nodes webpage behind authelia so that isnt whats being attacked. Also none of my other webpages also behind authelia are showing anything. Could I check that somehow? Would the logs show something?
Does everything stop when you stop the node?
I mean, yes? The only thing affected is the node. The node(unless the cpu has climbed to 250% of a core) has almost no affect on my server.
Just trying to figure out if the only issue is the node or something running on your server at the sametime. Are you only running a storagenode?
I have 77 containers total. Plex stack plus other stuff. No other containers are showing this behavior. Those arent accessing the storj drive though. Thanks for taking the time!
i think i might try
docker pull storjlabs/storagenode:latest
docker stop storagenode
docker rm storagenode
and then rerun the launch command…
maybe there was some error somewhere when you last updated it.
if max concurrent 4 doesn’t help it’s clearly not related to the disk.
remember to remove the limit on max concurrent again
aside from that i’m at a bit of a loss, i would ofc also do an apt updated apt upgrade on the container, maybe even a distro-upgrade if its far behind the hypervisor host.
i’ve recently had some weird issues running kernel 5.04 on a kernel 5.11+ host
was on a vm… but same issues might apply to containers also… i duno…
else i’m pretty much out of ideas.
hope somebody else has some better help to offer.
i doubt these fix it, but replacing the docker image / instance is pretty quick, and distro-upgrade… well its almost never bad to be running the most recent stable version.
ofc do the apt upgrade first… then redo the docker… and restart the container after the apt upgrade ofc…
I tried all of this and sadly no change. Still steadily increasing. Im hoping that when 1.47.3 hits docker that will fix my problem. Or that Storj employees will be able to look at my logs and discern the issue. Until then I will be restarting my node twice a day. Thanks for trying!