I’m sorry but I don’t understand this answer: You seem to say that, as @deathlessdd suggested “everything stop when you stop the node”, but then you say that the node has almost no effect on your server.
I’m confused Pardon me, as a non-native I might misunderstand stuff time to time
Are we sure the CPU usage rise is caused by the Storj Node? I guess so, considering your other replies though.
That’s gonna put a massive pressure on the disk as it will try rebrowsing all files on it twice a day I’m surprised all this isn’t simply the IO/wait caused by the filewalker process. Although on a CMR that’s usually not a big issue.
The only kinda similar rise of CPU usage on my side was caused by an SMR disk not able to keep up during the filewalker: the IO/wait would get worse and worse, hour after hour.
Is everything else looking good on the node? Scores? Success rates? Ingress/Egress compared to other SNOs?
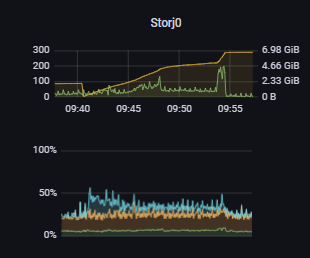
Sorry, Ill try to clarify. I have graphs of just the nodes usage and thats where the climb is shown. I could see the climb in total usage when it hit 250% of a core, but im not letting it get there anymore. Id rather not do it, but eventually it makes my server run at 100% cpu. Which i feel like is worse than some disk reads.
(Top graph is node. Green is CPU, orange is mem. Bottom graph is total CPU usage. Green is system, orange is user, blue is IOWait.)
Heres an example of when i restart the node. The iowait never even hits 100%. and goes away quickly(the mem usage falls with time too, to about 200MB). The CPU usage just by itself climbs. Nothing else does. Not memory usage or disk usage. The scores look the same, the success rates are 98+, ingress and egress had a spike during this period, but its normal now, everything seems fine. Its just like theres a “CPU Leak” or something.
When I look at your graph it really doesnt make any sense I have ran nodes for a total of 3 years and ive never seen them spike in the manner yours is, Either your not telling us everything that is going on your server or VMs because a single node doesnt do this, This to me looks like a memory leak in your system.
You should look at the total system to see where the problem lies because it looks like with everything running your staving performance.
Here i just restarted it. Minor affects to the system. Its able to file walk just fine when restarted. IDK man. I didnt change anything about my other containers or anything. Nothing else is doing this and its never done it before. I can stop everything else my server is doing(plex, deluge, sonarr, radarr, prowlarr, vpns, minecraft server, valheim server, grafana, influxdb, prometheus, etc) and it doesnt change the weird increase. Im running docker containers on bare metal ubuntu. No VMs.
Just the fact that it climbs up in ram isnt a good sign…and you do know docker containers are vms right?
I have a few nodes on rpi4s and they never climb in ram, and I run proxmox with a node running in a vm and it never does this.
You said you were running 77 containers on a single machine, thats alot of containers.
did you try to limit the CPU to 1 and the memory to a specific maximum for your storagenode docker container? Then it won’t affect your whole system and the node will only be able to use the specified amount of resources. Then you can see if it is still increasing or if the node runs just fine with the limits.
Maybe the increasing memory is page cache or some other linux cache that is shown as “used” in your graphs, but is in fact memory that the system will release once it is requested?
The ram falls back down after a while, while the cpu just climbs from there where the ram sits normal. Yeah IK containers are basically just VMs, but there is a difference. Yeah I have a lot of running projects, only about 40 are running full time and most of those are background most of the time. The usual CPU usage is around 20% on a ryzen 5 2600. I havent seen any signs of issues with what im doing before about a week ago. And this server has been running for over a year with 80% of what I have on here. With no changes recently. Plus when I kill everything else, the storj container keeps rising. I fully accept that it could be something Im doing outside the container, but it seems odd that it would ONLY affect the storj container and that it would happen out of the blue. the container had been up for about a day running fine before it even started rising. Im debating trying to move it to a RPI4 I have to see if that fixes it. Just not looking forward to the process.
Well the problem is that storj nodes require alot of I/O compared to your other containers just remember all containers are using the same system to run and storj is probably needing the Most I/O and when you climb in ram that is usally a sign the I/O is not able to keep up.
If you have a rpi4 is super easy to move you just plug your drive that your using into the rpi4 and restart the node the process cant be any easier to do.
Ill give the limit a shot. It could at least be a bandaid. The memory usage is totally just cache. It fall back down slowly. Its just high at container start. Falls back down to about 200MB eventually. My 32GB of ram sit around 30% almost all the time. It hasnt hit 100% at all in the last week.
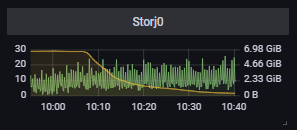
The ram doesnt climb. Its just the initial file walk. Heres the ram going right back to normal after i restarted it this morning.
And heres a zoom of after the walk, you can see the CPU usage climb as ram falls.
Im trying it now. Its capped the usage spike at restart so the file walking is taking way longer than normal. Well see how it does long term. I wish I could have the CPU cap kick in after an hour to let it startup unrestrained. That would be perfect.
Make sure that’s not caused by the node crashing during the filewalker process (and restarting) regularly. That can be spotted in the logs by looking for lines telling you configuration got loaded more often than it should.
just give it a single core and it should be fine with that, then it won’t disturb your other activities on the server, even if it goes off the charts…
restarting it all the time, is not a very viable solution.
and it doesn’t really give you any idea of how it behaves under steady state… ofc since it hasn’t done this before, then the increased cpu usage is weird… ofc if you keep stopping it and it is actually trying to do something, it might never get done.
They’re not. There is no virtualized hardware in between so you can’t speak of a virtual machine. (Unless you’re running linux containers on windows or vice versa. In that case your containers run inside a VM)
It’s basically a chroot with process isolation and some other tricks on top. Definitely not a vm. Processes run directly on the physical hardware with no virtualization layer.