Hello all, I am running storagenode on a raspberry pi with a USB storage device. Recently, I started experiencing storagenode crashes. I could not manually start the storage node. I need to reload the pi to get the container start again. Where should I see logs for this behavior? journalctl or docker logs does not seem to point to an issue. When container crashes, I do not see the USB drive under df -h output. Do you think the USB drive is dropping off and the container is crashing? Thank you.
Please, post last 10 lines from the log after the crash: How do I check my logs? - Node Operator
It looks like OOM so far. Please, give me result of the command:
free
@Alexey Please find those logs below.
pi@StorJ-Node:~ $ sudo docker logs --tail 20 storagenode
storj.io/drpc/drpcstream.(*Stream).HandlePacket(0x359da40, 0x3412a80, 0x95f, 0xa80, 0x1, 0x0, 0x3, 0x0, 0x2, 0x0, …)
/go/pkg/mod/storj.io/drpc@v0.0.24/drpcstream/stream.go:173 +0x46c
storj.io/drpc/drpcmanager.(*Manager).manageReader(0x4ce70a0)
/go/pkg/mod/storj.io/drpc@v0.0.24/drpcmanager/manager.go:200 +0x400
created by storj.io/drpc/drpcmanager.NewWithOptions
/go/pkg/mod/storj.io/drpc@v0.0.24/drpcmanager/manager.go:95 +0x2d0
goroutine 1418745 [runnable]:
storj.io/drpc/drpcwire.NewReader(...)
/go/pkg/mod/storj.io/drpc@v0.0.24/drpcwire/reader.go:26
storj.io/drpc/drpcmanager.NewWithOptions(0x66ae97f0, 0x3efd600, 0x400, 0x1f00, 0x0, 0x0, 0x0, 0x0, 0xffffffff, 0xffffffff, …)
/go/pkg/mod/storj.io/drpc@v0.0.24/drpcmanager/manager.go:74 +0x118
storj.io/drpc/drpcserver.(*Server).ServeOne(0x3076390, 0xcf4f70, 0x31f2f80, 0x66ae97f0, 0x3efd600, 0x0, 0x0)
/go/pkg/mod/storj.io/drpc@v0.0.24/drpcserver/server.go:47 +0x64
storj.io/drpc/drpcserver.(*Server).Serve.func2(0xcf4f70, 0x31f2f80)
/go/pkg/mod/storj.io/drpc@v0.0.24/drpcserver/server.go:95 +0x50
storj.io/drpc/drpcctx.(*Tracker).track(0x31f2f80, 0x332df30)
/go/pkg/mod/storj.io/drpc@v0.0.24/drpcctx/transport.go:52 +0x2c
created by storj.io/drpc/drpcctx.(*Tracker).Run
/go/pkg/mod/storj.io/drpc@v0.0.24/drpcctx/transport.go:47 +0x50
@Alexey Sorry, I did not collect the memory state before reloading. I will need to wait for next time to catch that information.
The root cause is very easy:
Here is an example:

If your Rpi does have not enough memory, the container will crash.
Here another bad example:

But why storage node in the last time starting consume so much memory? - it an open question
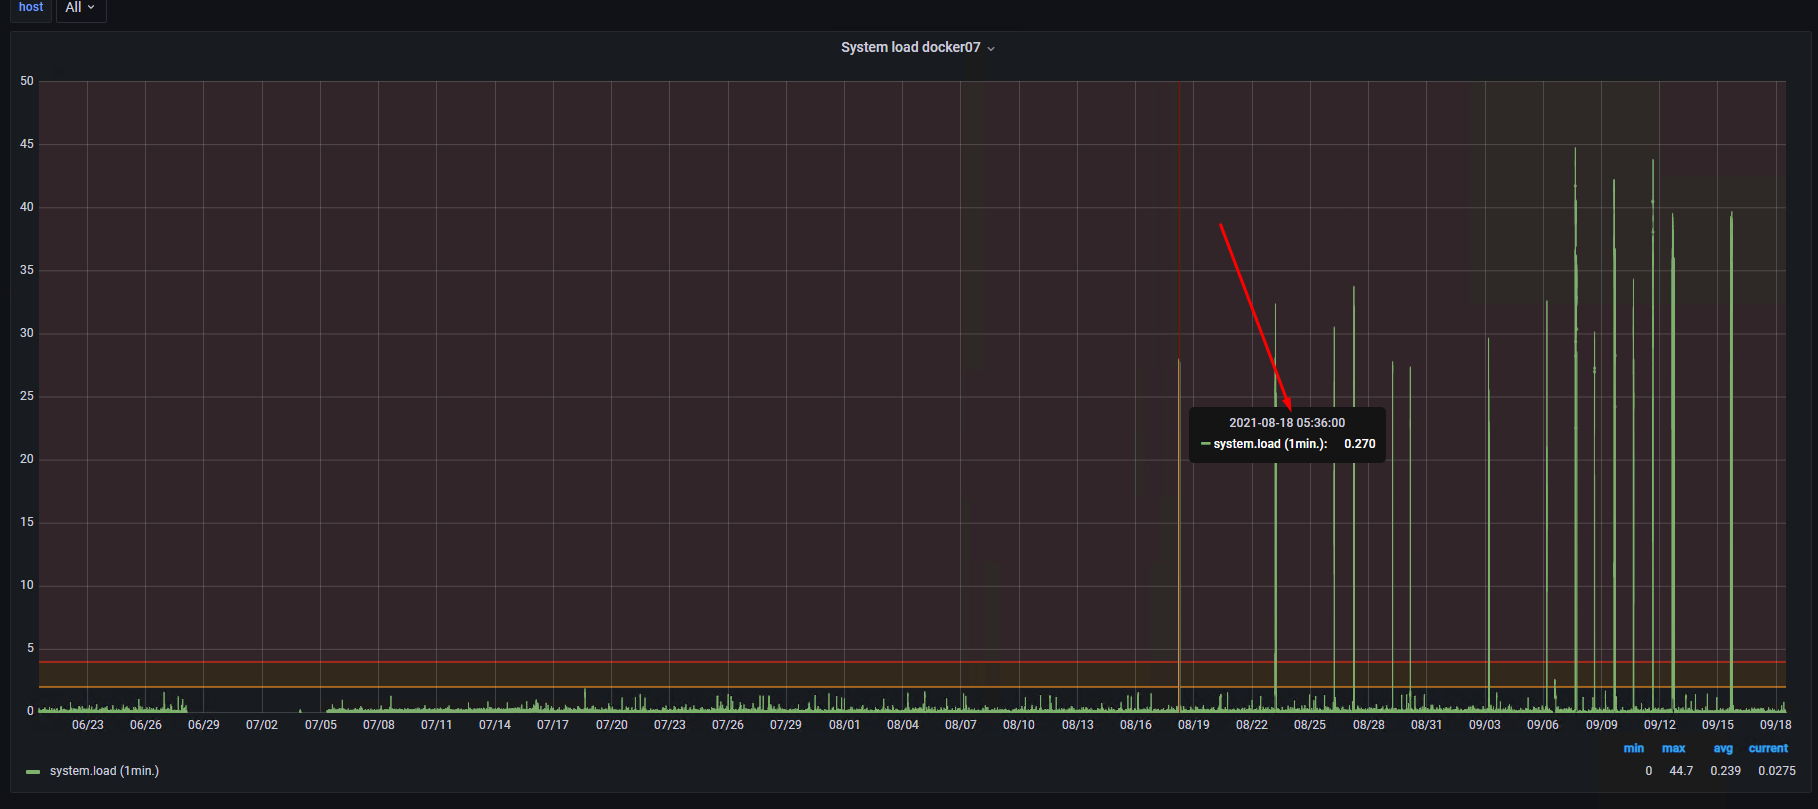
I believe this history picture can help Storj Labs determine what’s going on and when it started:

CONTAINER ID   NAME           CPU %     MEM USAGE / LIMIT     MEM %     NET I/O          BLOCK I/O        PIDS
febe9a5f791a   netdata        3.14%     194.7MiB / 31.05GiB   0.61%     129kB / 190kB    114MB / 47.3MB   53
ac03cf226b9c   storagenode3   1.12%     7.402GiB / 31.05GiB   23.84%    207MB / 402MB    3.65GB / 241MB   21
06e911ea5610   storagenode2   5.54%     363.6MiB / 31.05GiB   1.14%     759MB / 516MB    19.3MB / 0B      28
791eca9991eb   storagenode5   0.00%     1.219GiB / 31.05GiB   3.93%     4.72MB / 202MB   11.6MB / 627kB   19
dc40e55fbf47   watchtower     0.00%     4.77MiB / 31.05GiB    0.01%     18kB / 0B        10.9MB / 0B      8
Perhaps your disk system is too slow?
I migrated to Ubuntu and right now I perform the pvmove to other partition of the same drive, so IO should be cut twice. My node have 2TB of free space, so…
The node which is affected by slowing - storagenode3, and this is obvious from the stat.
The storagenode2 and storagenode5 are on NTFS (yet).
The storagenode2 have a free space ~200GB
The storagenode5 have a lot of (small) egress requests, but it’s smallest of the nodes (700GB)
My recommendation - to take a look on disk subsystem.
The stat from the node on raspberry Pi3:
CONTAINER ID   NAME          CPU %     MEM USAGE / LIMIT     MEM %     NET I/O           BLOCK I/O   PIDS
1cf77d2ff8bf   storagenode   0.00%     206.4MiB / 800MiB     25.80%    0B / 0B           0B / 0B     22
1d1bd6798606   watchtower    0.00%     2.793MiB / 924.2MiB   0.30%     17.2MB / 1.84kB   0B / 0B     11
No, it is not a root cause (but I’ve also suspected it on the first look). I have a few storage nodes on different locations with the same hardware configurations, but only two have this issue. So, I started digging and found a difference - it is a memory that is allocated for storagenode docker container.
The root cause - is not enough memory for the ripper/collector peak operations
My container was limited to 4GB of memory I think it was more the enough, but for “ripper/collector” it is also not true rigth now.
I increases the limit twice (8GB), and after it I saw this picture with memory:

as you can see the peaks are too high (much more than 4GB), but for normal operation (without “ripper/collector”) 4GB is more than enough.
What we have on the CPU IOWait time on the same period after increase memory to 8GB:

What we have on the System load on the same period after increase memory to 8GB:
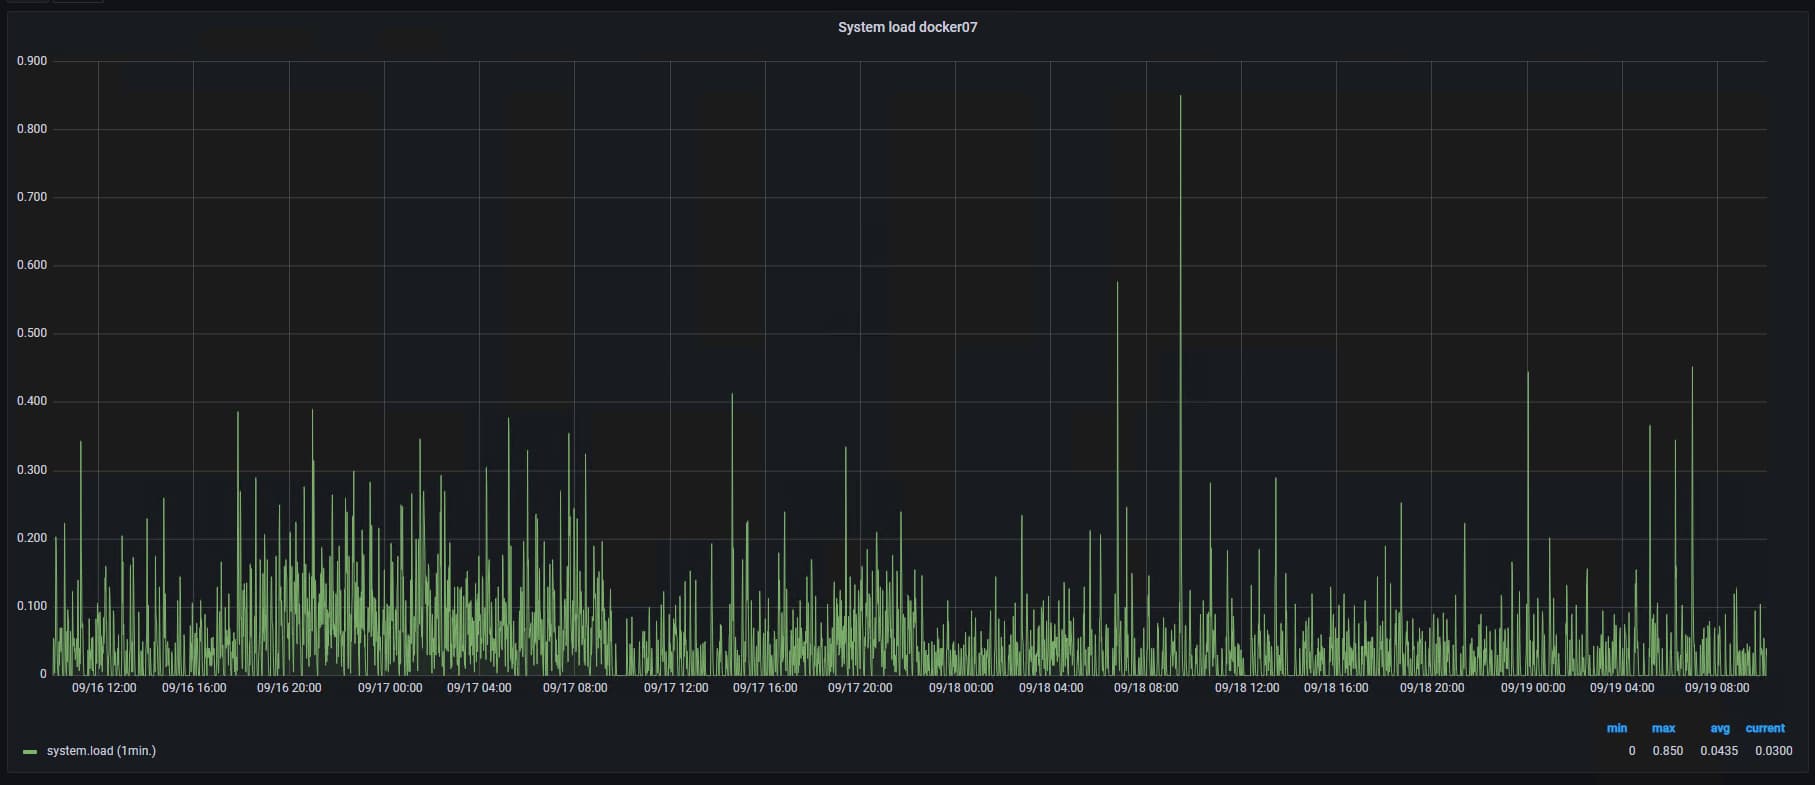
As you can see, increasing memory to 8GB solved this problem.
So questions, why “ripper/collector” started to, consume a lot of memory is open
PS. I attaching the same graphs when this node has 4GB of ram to compare
RAM:

CPU IOWait time:

System Load:
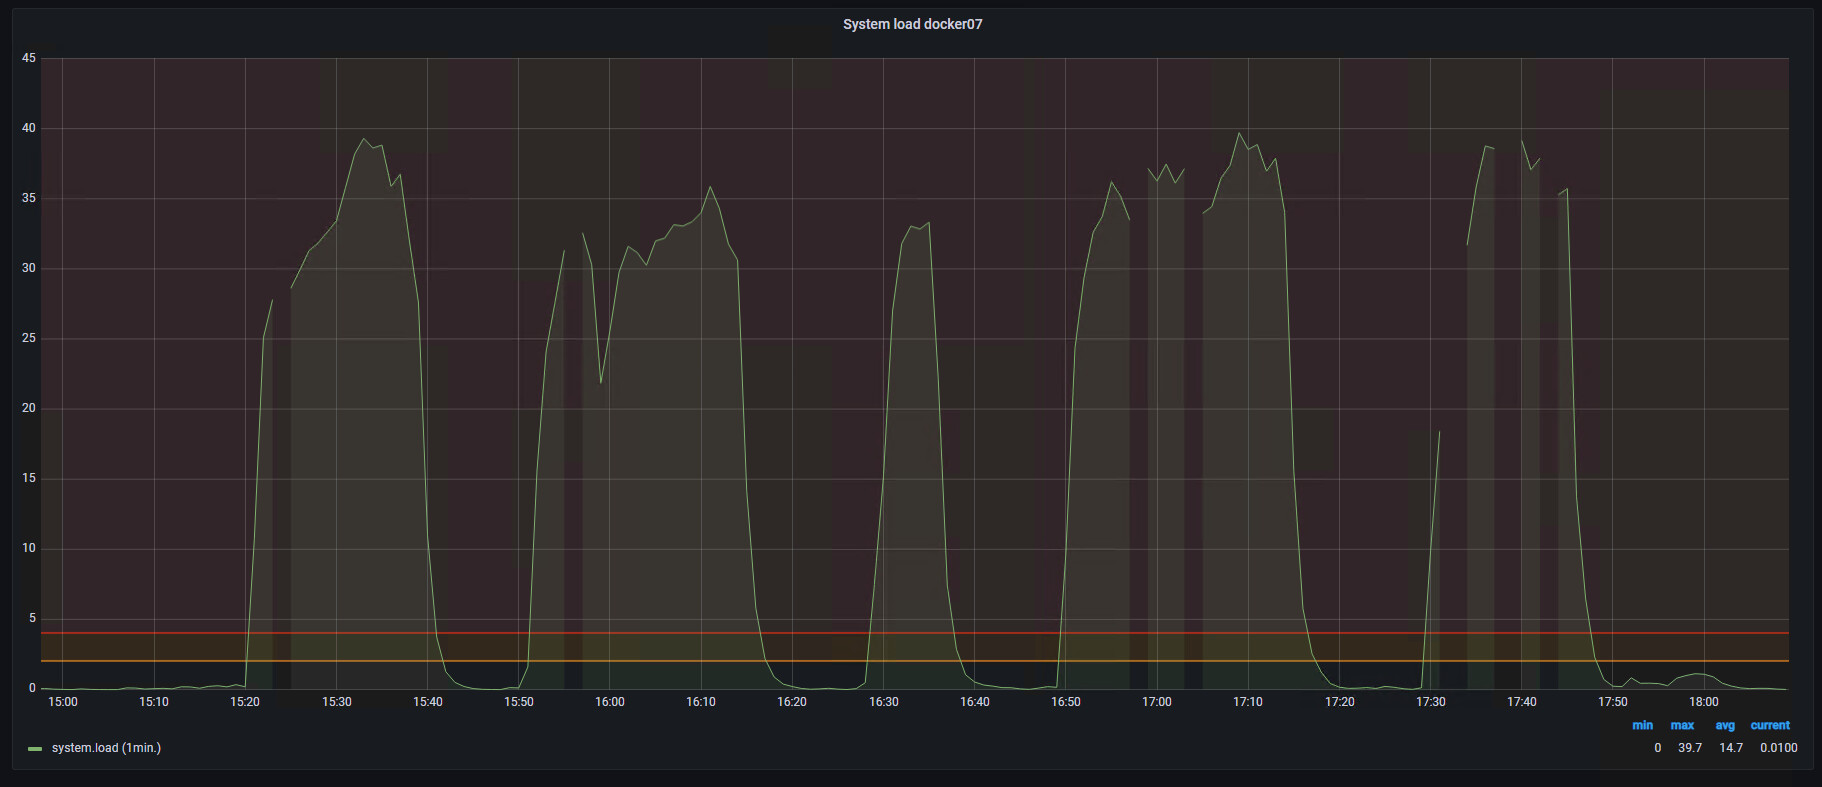
The gaps on the graphs it big problems with node, stop responding, OOM killer in action, etc.
I think this information will be helpful.
@Alexey and @Odmin This crashing started occurring very recently. I can say that it started with the recent container update. I checked the memory of Pi when the container crashed using “free” command. It had almost half the memory available. I use 800MB memory for the container. I have 1GB memory on my Pi. Anything else I need to check find the root cause? Thanks for your help again.
The excerpt from the log doesn’t allow me to identify an issue.
Please, stop and remove the container
docker stop -t 300 storagenode
docker rm storagenode
Then remove the image
docker rmi storjlabs/storagenode:latest
Then download the image back
docker pull storjlabs/storagenode:latest
and run your container with all your parameters.
@Alexey Thanks. I did that couple of days back. Unless new version is out in last couple days.
@Alexey I see the logs below after container crashed.
Error: lstat config/storage/blobs/ukfu6bhbboxilvt7jrwlqk7y2tapb5d2r2tsmj2sjxvw5qaaaaaa/s3/ojxxd3g4ixfebhsv3zdblvq64usz5qbf3df4bvanps4dvhtg7q.sj1: software caused connection abort; open config/storage/blobs/v4weeab67sbgvnbwd5z7tweqsqqun7qox2agpbxy44mqqaaaaaaa: transport endpoint is not connected
Please also find free output below.
root@StorJ-Node:/home/pi# free
total used free shared buff/cache available
Mem: 945372 61528 655524 924 228320 821784
Swap: 102396 45656 56740
I see that USB disk is mounted under mount when the container crashed, but I did not see that drive under df -h output. I am not sure what is happening.
Seems you need to check your drive and also the cable and your external power supply for this drive.
I’m not sure if it’s the same problem or not but my Raspi CM4 (with IO Board) keeps unmounting two USB drives every now and then. I have to re-mount them manually.
SATA connected drives work fine.
Will try connecting the USB drives directly via SATA and see if it helps. But that might not be an option for a regular Raspi.