Was wondering if anyone has seen anything like the belwo before.
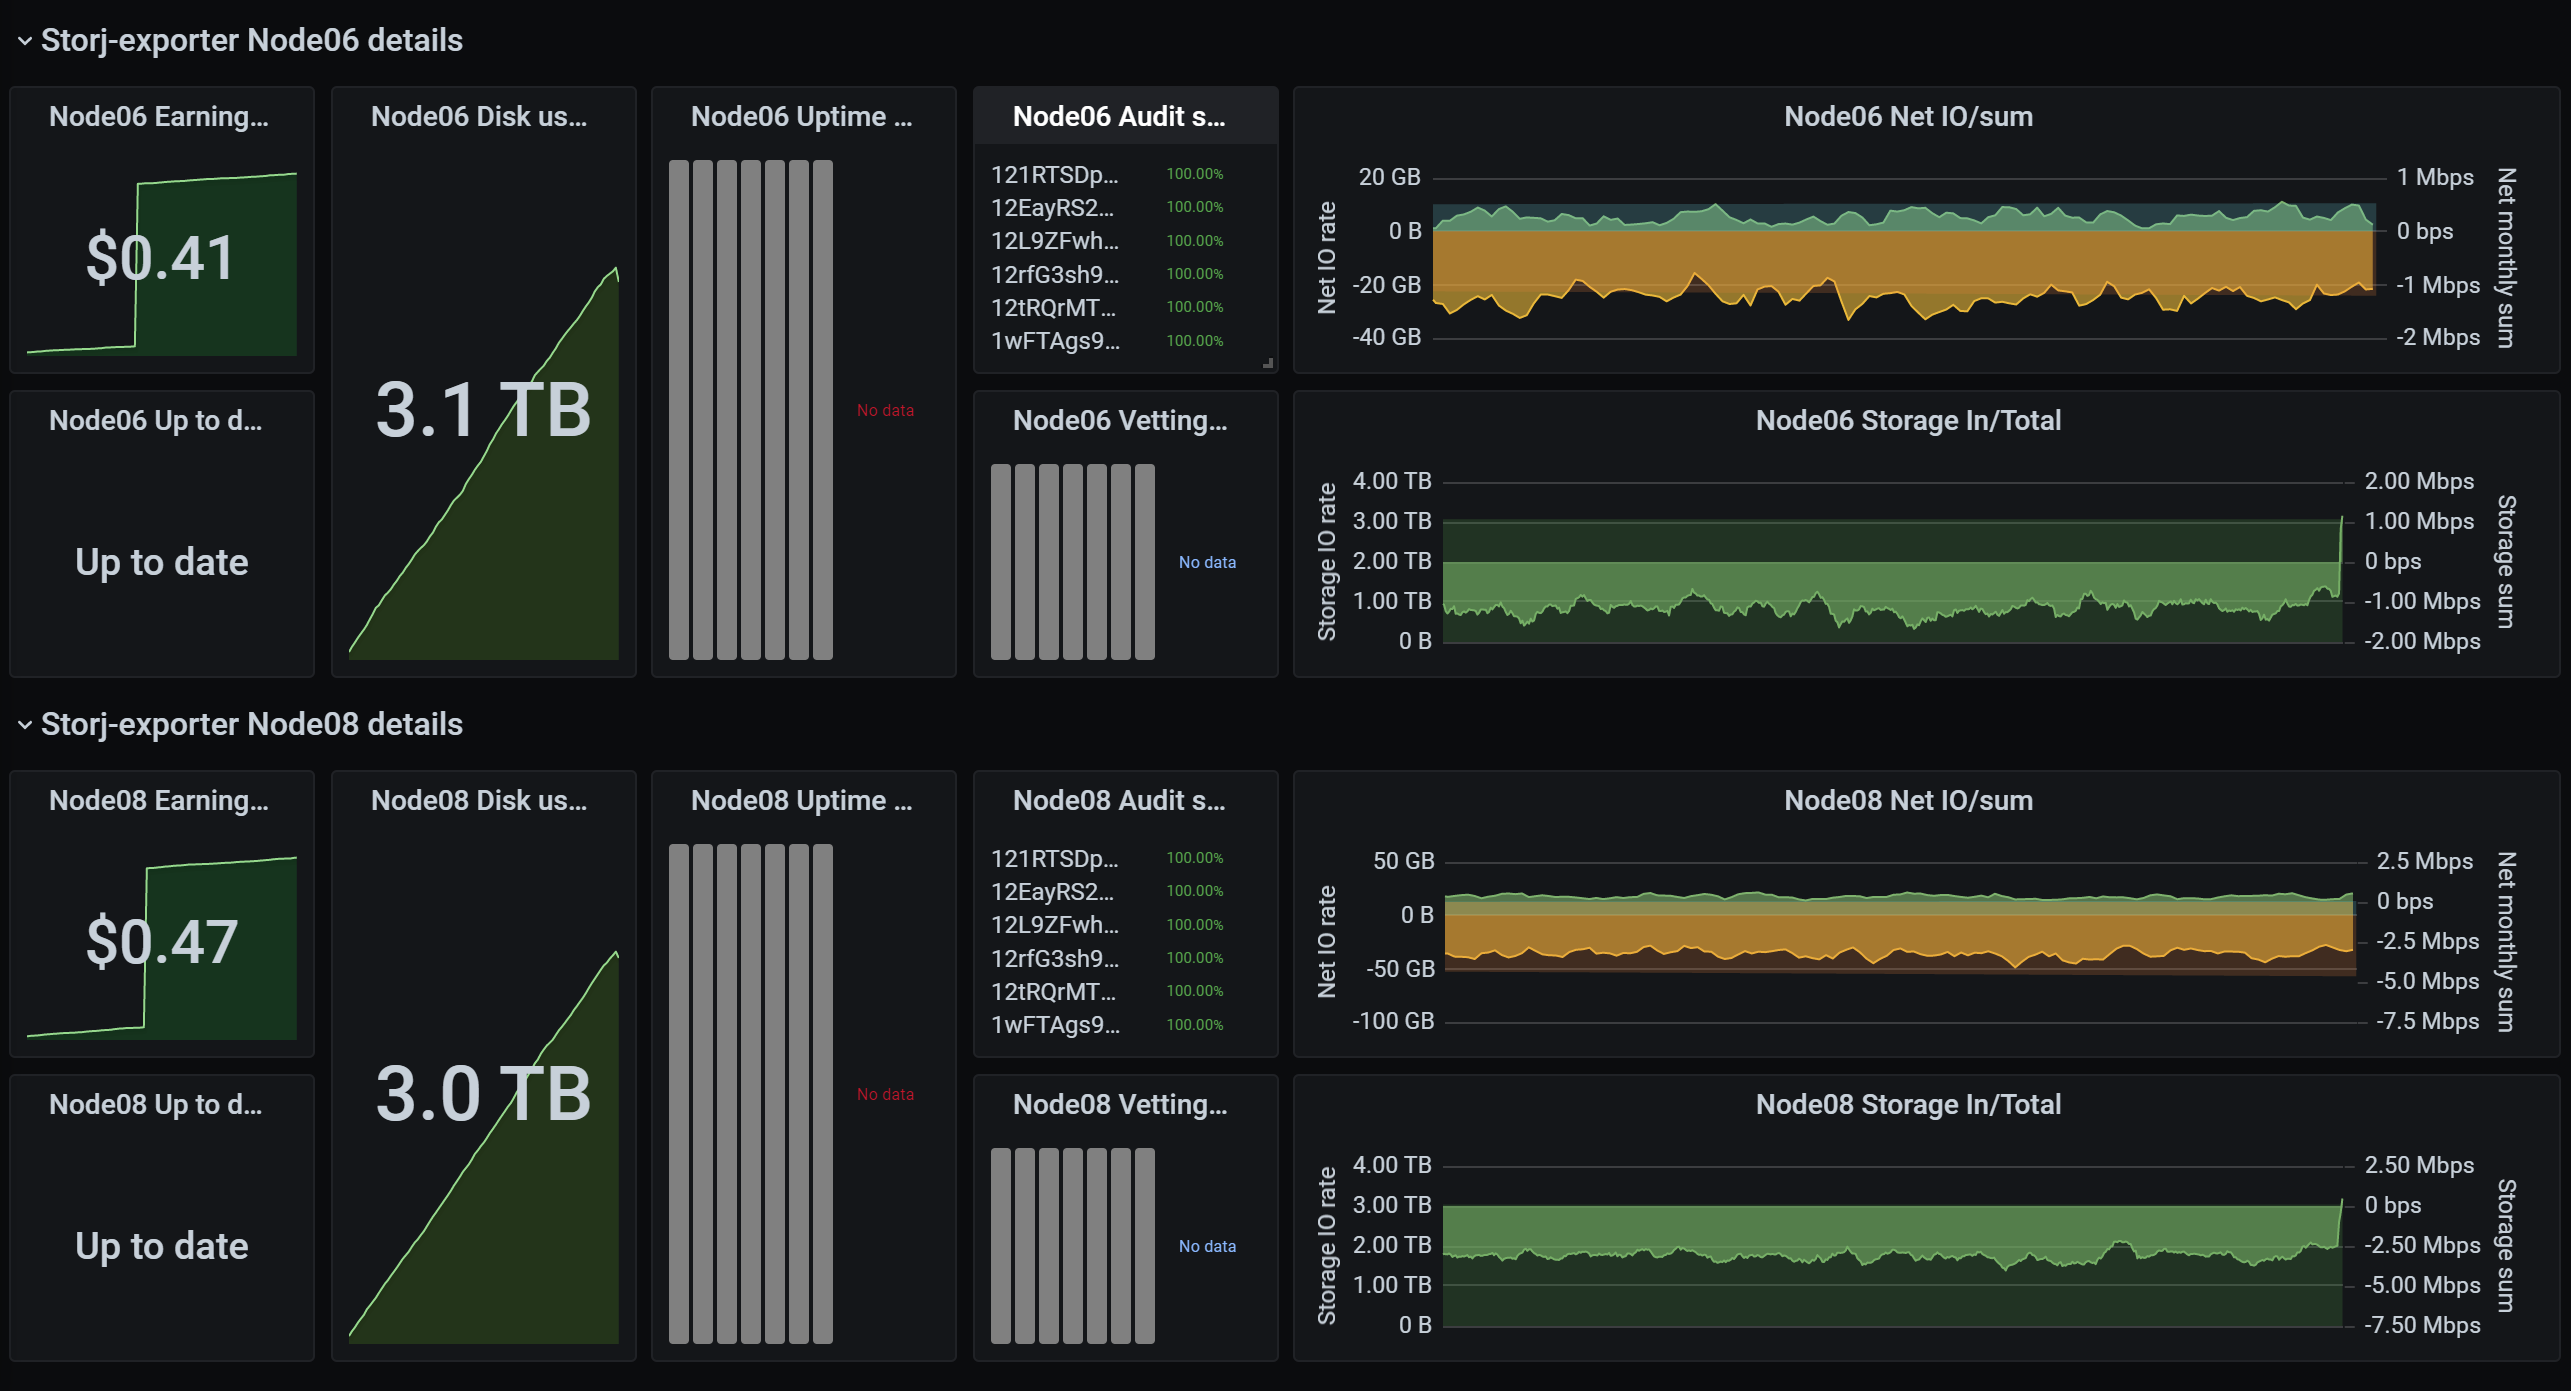
Basically I have multiple Storj nodes running, i have promesthious and Grafana all set up and working, but for some reason Grafana doesn’t show statics for 2 of my nodes. I’ve checked promesethous and in targets it should all nodes are up. When i look in Grafana it can see all nodes all node in total storage and net IO, but when i scroll down details are not there.
If you are using the metrics endpoint of the storage node you have to make sure the storage node updater is not using the same port otherwise your grafana dashboard will get the metrics of the storage node updater. Who ever blocks the port first will win.
My solution to that problem was to specify a different port in the systemd file of the storage node updater. The reason I did it that way around was to make sure everything I put into my config file works for the storage nodes and the updater just ignores one value.
Thanks, are you able to provide me anymore guidance as to how to implement your fix?[quote=“littleskunk, post:4, topic:19269, full:true”]
If you are using the metrics endpoint of the storage node you have to make sure the storage node updater is not using the same port otherwise your grafana dashboard will get the metrics of the storage node updater. Who ever blocks the port first will win.
My solution to that problem was to specify a different port in the systemd file of the storage node updater. The reason I did it that way around was to make sure everything I put into my config file works for the storage nodes and the updater just ignores one value.
[/quote]