StorjNode Monitor Free - check it out

StorjNode Monitor - Free Cloud Monitoring for your Storj Nodes

Website: https://storjnode.net


What is StorjNode Monitor?

StorjNode Monitor is a completely free cloud platform for monitoring your Storj Storage Nodes - from anywhere, without complicated setup.

You know the problem: Installing Prometheus, configuring Grafana,
opening ports, adjusting firewall… It’s tedious and error-prone. We solved that for you.


Benefits at a Glance

Feature StorjNode Monitor
Cost Completely free
Setup Time < 5 minutes
Prometheus/Grafana needed? No
Port forwarding needed? No
Multi-Node Support Yes, unlimited
Access From anywhere via browser
Update Interval Every 5 minutes
E-Mail Alerts Yes, on node outage
Subnet Neighbor Check Directly in dashboard
Windows Support Yes, with GUI app
Docker Support Yes, ready-to-use image available

E-Mail Alerts on Node Outage

Get notified immediately via email when your node goes offline!

How to activate alerts:

  1. Enter your node IP with port in the dashboard, e.g.: 123.45.67.89:28967

  2. Add your email address

  3. Done - you’ll be automatically notified on outage

Never miss downtimes that cost you reputation and earnings again!


Subnet Neighbor Check - Directly in Dashboard

Did you know that Storj only fully pays one node per /24 subnet? Multiple nodes in the same subnet share the earnings!

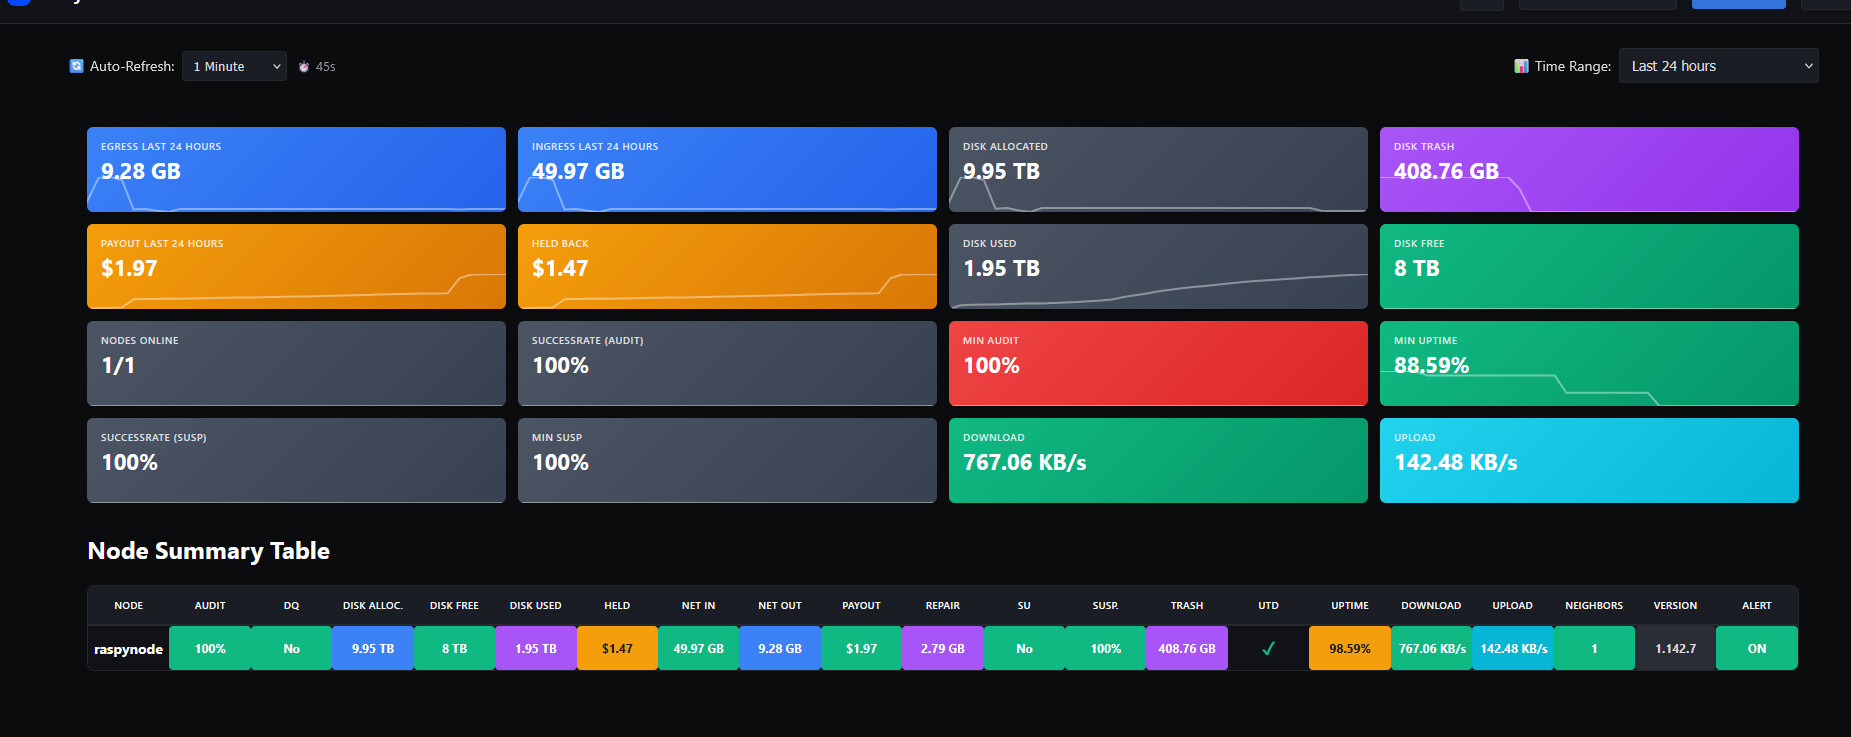
Our dashboard shows you directly how many nodes are running in your subnet:

Neighbors: 1 = All good, only your node in the subnet

Neighbors: 3 = Warning! 3 nodes are sharing the earnings

No extra tool needed - just read it in the dashboard and instantly know if neighbors are cutting into your earnings!


What is being monitored?

Node Status:

  • Node Name

  • Version

  • Uptime

  • UTD (Up-to-Date Status)

Storage:

  • Disk Alloc. (Allocated Storage)

  • Disk Free (Free Storage)

  • Disk Used (Used Storage)

  • Trash

Network:

  • Net In (Incoming)

  • Net Out (Outgoing)

  • Download

  • Upload

  • Repair

Finances:

  • Payout

  • Held (Held amounts)

Node Health:

  • Audit Score

  • Suspension Score (Susp.)

  • SU (Suspension Status)

  • DQ (Disqualification Status)

Extras:

  • Neighbors (Subnet Check)

  • Alert Status


How to get started

1. Create account

2. Copy API key from the dashboard

3. Start Docker container:

docker run -d \
  --name storj-monitor \
  --restart always \
  --network container:storagenode \
  -e STORJ_API_KEY_FROM_STORJNODE=YOUR_KEY \
  -e STORJ_HOST_LOCAL=127.0.0.1 \
  raspy23/storjmonitor:latest

4. Optional: Activate E-Mail Alert

  • Enter node IP with port (e.g. 123.45.67.89:28967)

  • Add your email address

5. Done! Dashboard shows your data after 5 minutes.

Windows users: There’s also an installer with GUI - no Docker needed!


Why should you use this?

  1. Zero infrastructure effort - No Prometheus, no Grafana, no local database

  2. E-Mail Alerts - Instant notification on node outage

  3. Neighbor Check - See directly in the dashboard if neighbors are sharing your earnings

  4. Secure - No port forwarding needed

  5. Multi-Node Dashboard - Compare all your nodes at a glance

  6. Historical Data - Analyze trends over 30 days

  7. Completely free - No hidden costs, no limits


Technical Details

  • Docker Image: raspy23/storjmonitor:latest (Python 3.11 Alpine, minimal)

  • Windows: Standalone .exe with system tray support

  • Data Source: Local Storj Node API (Port 14002)

  • Security: HTTPS-only, API key authentication

  • Data Retention: 30 days historical data


Future & Feedback

If the project is well received, an iOS and Android app is planned!

Found bugs or have ideas? Just PM me - I appreciate any feedback!


Try it out!

Free and set up in 5 minutes.

https://storjnode.net


Many changes will still be made; this is a beta version.

Developed by node operators for node operators.

5 Likes

I like the idea: but you may have to call it something else.

Having “Storj” in the name could cause users to think it’s an official offering from Inveniam: and for the amount of money they just paid for Storj they probably aren’t going to allow others to capitalize on their trademark. (You even copied their favicon in browser tabs?)

Or maybe they’d encourage it. I dunno :person_shrugging:

Thanks for the heads up!

I’ve already removed the Storj favicon - a custom logo is coming soon.

Regarding the name: StorjNode.net will stay. The name clearly describes what it does - monitoring for Storj nodes. It’s a community tool made by node operators for node operators, not an attempt to impersonate or capitalize on Storj/Inveniam.

Actually, Storj benefits from this too - when it’s easier for operators to monitor their nodes, they stay online longer, maintain better uptime, and catch issues early. Happy node operators = healthier network.

If they ever have concerns, I’m open to a conversation - but I don’t see a conflict here.

Its better to have a disclaimer at the bottom that you are NOT Storj Inc.

Updated after debugging.

Resolved - fat fingers/typo

Just tested with a node from one of my hosts, and it’s not so straight forward if multiple nodes are running within the same compose project/network - it would require fixed IPs.

Alternative, make it accept a hostname for STORJ_HOST_LOCAL, just like it’s done with other exporters:

  storj-monitor-node22:
    image: thechristech/storj-exporter:latest
...
    environment:
      - STORJ_HOST_ADDRESS=node22
    depends_on:
      - node22

With this, it dynamically resolves the nodes name from the local docker.

Resolved by debugging

Ideally I would run this separately from my nodes, and use my already existing LAN access to the debug on 14002 through custom mappings. This would require your exporter to use a custom IP + PORT for connection, however, it would be static setup as it’s already setup for me. Much easier to integrate.

Just a few cents from me :slight_smile:

Otherwise, great project - looks good! :partying_face:

It seems there already is an option STORJ_API_PORT - I’ve used this one.
Perhaps just a more detailed description of what can be configured ?

Also, Node Summary Table would be nicer if you can sort by headings - at the very minimum “node” name, but ideally all headings.

Starting Monday, the panel will be expanded, many bugs will be fixed, dashboard sorting will be added, and there will also be a video explanation of how to use the node client.

Public IP/Port of node also fails when updating:

Not sure if it’s because I set a hostname instead of an IP. But it should accept hostname:port.
After the error message, the data IS updated?!

Great - looking forward to it :slight_smile:

Regarding this:

It seems I just have fat fingers, typo on my end - it works fine.

I’ve setup docker compose like this (confirmed to work):

  storj-monitor-node22:
    image: raspy23/storjmonitor:latest
    container_name: node22
    restart: always
    environment:
      STORJ_API_KEY_FROM_STORJNODE: <removed>
      STORJ_HOST_LOCAL: node22
      STORJ_API_PORT: 14002
    depends_on:
      - node22
1 Like

@monitor-free BTW - out of interest, who are you..?
Your account was created 10 hours ago, and this seems to be the work of a seasoned Node Operator :wink:
No information on git, this board or the storjnode.net website

3 Likes

Don’t be surprised if storjnode.net is a bit buggy—I built it in only two days. I’ve been involved with Storj since 2019. At one point, I had 1.5 PB of allocated space, hosting around 700–800 TB of data. However, I had to shut it all down after the pricing structure changed. Right now, I’m only running three nodes, and I know exactly how annoying it is to keep track of everything. I believe http://www.th3van.dk/ is one of the largest operators.

1 Like

Done! The Node Summary Table now supports sorting by all headings. Click any column header to sort - click again to reverse the order.

Like my fellow SNO pointed out… new account, no github, free tool offering… smells verry fishy.
“Hi, I’m new here and I want you to offer this free software. Just install it and trust it.”
I’m surprised some of you already installed it.
Don’t get me wrong, I don’t say you are a bad actor, but these are all the signs of one. And as far as we don’t know who you are and what are your intentions, I, at least, will stay clear of it, and let it cook for a few months/years.
But the project looks nice and will be usefull.

6 Likes

Well done, KUDOS.
Maybe you could add DDNS resolution for the alerts?

hanks for the kudos! Great timing—I’ve actually just implemented DDNS resolution for the alerts, so that’s now fixed and ready to go.

Also, just a heads-up: I’ll be publishing the GitHub repository for the project tomorrow, so everyone can check out the code and see exactly how it’s built!

3 Likes

Hi ich interresiere mich sehr für dein Project. Ich habe 9 knoten muss ich bei alles den docher starten und dann auf der Webseite alles zusehen oder ist der Docker das Dashboard. Ich bin neu in der sache . Kannst du mir eine genaue anleitung geben?

Please check your email. A tutorial video will be available on the dashboard tomorrow.

Hi! Thanks for your interest in the project!

Great news - we just created a detailed installation guide, even in German especially for you!

Check it out here: https://storjnode.net/download.php

To answer your questions:

  1. Yes, you need to run the Docker monitor for each node - so for your 9 nodes, you’ll run 9 monitor containers (one per node)

  2. The Docker container is NOT the dashboard - the Docker container just collects data from your node and sends it to our website. The dashboard where you see all your nodes is at https://storjnode.net

Quick overview of how it works:

  1. Register a free account at https://storjnode.net

  2. Click “Add Node” in the dashboard to get an API key (you need 9 API keys - one for each node)

  3. Run the Docker monitor container for each node with its own API key

  4. After ~5 minutes, your nodes will appear in the web dashboard

The guide at https://storjnode.net/download.php has step-by-step instructions with examples for multip

Have you all lost your minds?

  • Fresh forum account created for promotion.
  • No source code. No repository. No license. No audit
  • Website has no “About Us”, no operator name, no company, no jurisdiction, no privacy policy. Nothign at all
  • Requires granting a third party acces to your Storj node API.
  • Pure marketing text. No architecure. No threat model

The author also claims this was built “in two days”

That claim alone is telling. A serivce that ingests node telemetry, authenticates users, stores historical data, sends alerts, and claims reliablity cannot be responsibly designed, implemented, secured, and tested in that timefrmae

There is no way to distinguish incompetence from malice here

Granting node acces to an anonymous, unaudited service rushed out in days is negligence

If this seems acceptable to you stop operating nodes

Minimum bar before this deserves attention:

  • Publish the code
  • Identify who is behind it
  • Get an independent audit

The fact that this is being discussed seriously is itself an issue.

13 Likes

Guys, be careful. I’m not saying there are malicious intentions behind this post, but at least wait until the code is published on GitHub. That seems like the bare minimum. Be safe. Use condoms

2 Likes

Security & Transparency – Response to the concerns

I understand the skepticism – it’s actually good that someone is thinking critically! Let me address the points:

1. The client is now Open Source

2. What this project actually is This is a hobby project by a node operator FOR node operators. The motivation: I wanted to monitor my nodes on the go – and the existing solutions didn’t convince me. No venture capital, no investor interests, no data mining business model.

3. The Storj Node API (Port 14002) Let’s look at the facts:

  • The API is only accessible locally (127.0.0.1)
  • The API is read-only – no write functions exist
  • It’s the same data you see in the local node dashboard
  • Storj intentionally designed the API to only allow read access

4. What data is sent – and what isn’t

Data Docker Windows
Node ID :white_check_mark: Sent :white_check_mark: Sent
Disk space :white_check_mark: Sent :white_check_mark: Sent
Bandwidth :white_check_mark: Sent :white_check_mark: Sent
Audit scores :white_check_mark: Sent :white_check_mark: Sent
Wallet address :white_check_mark: Sent :cross_mark: Not sent

5. What you CANNOT do with this data

“Attack” Possible? Reason
Shut down node No API is read-only
Delete data No No write access
Steal wallet No Wallet KEY is never transmitted
DQ the node No Only Storj can do that

6. Who’s behind this? A node operator from Germany. The service is free – if the project is well received, I’ll upgrade to a proper Hetzner server. No hidden costs, no premium model, no data selling.

7. E-Mail alerts For online monitoring you don’t need to enter an IP. E-Mail alerts for offline nodes require voluntary manual entry of the IP in the dashboard – clearly labeled what it’s for.

Conclusion: I can understand the skepticism about third-party services. That’s exactly why the code is now public on GitHub. Look at it, review it, ask questions. The data is purely informational – the same statistics that run locally on your node anyway.

If you still don’t want to use it: That’s totally fine! This is an optional service for those who want it.

2 Likes