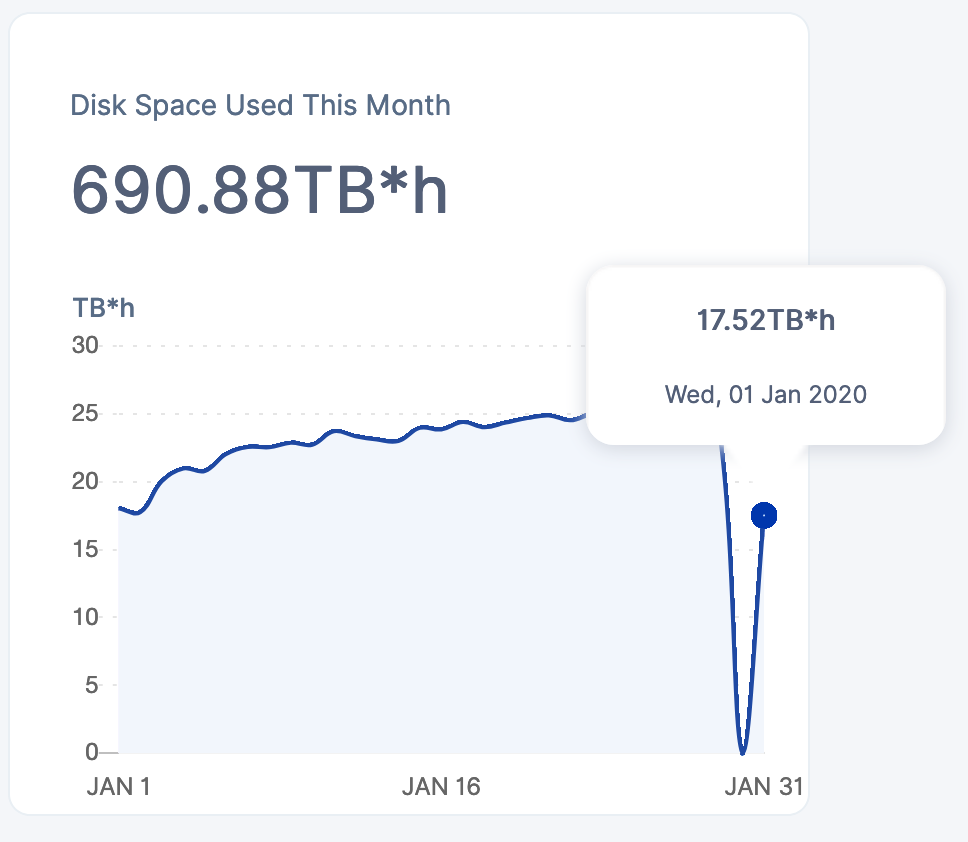
Mousing over shows that the graph has wrapped around to January 1st 2020. The dip just before that is today’s date, January 31, 2020. The Jan 1, 2020 isn’t available on the left. It starts at Jan 2.
Anyone else have this UI glitch? Happens on Disk Space Used This Month also.
There were 3 node updates yesterday… There was also a issue reported yesterday. I wonder if everybody did not use much bandwidth that day. I run GUI by the way…
Same issue here. My graph mouse over labels start with January 02 and end with January 01 with January 31 between them. Node is raspberry pi 4 browser is Firefox (on windows 10). Looks the same on Chromium.
This issue is caused by wrong use of timeszones by storagenode software.
Data collection/statistic module use UTC time. And dashboard is using local node time (adjusted to local timezone) without proper time conversion.
This produces some strange glitches as there are 2 different moments for start of each day and each month:
one start of day/month by UTC time
one start of day/month by local node time
Glitches will differ based if node is ahead of UTC (UTC+xx) or behind (UTC-xx). And only users from GB (local time = UTC/GMT time) will get fully correct graphs.