Successrate.sh comparison thread

I noticed that my upload and repair upload scores are not looking that pretty, does anyone else have such low scores too?
How can i best go about raising this score? I don’t have physical access to the machine, it is located in Finland and i am in Switzerland so i only have remote access.

Hardware : Intel® Xeon® E3-1270 v3 Quad-Core Haswell, 32GB ECC DDR3 RAM - 4 drive SATA 7200 rpm Raid5
Bandwidth : 1gbps full duplex
Location : Helsinki, Finland
Node Version : v1.1.1
Uptime : 12hr

========== AUDIT ==============
Critically failed: 0
Critical Fail Rate: 0.000%
Recoverable failed: 0
Recoverable Fail Rate: 0.000%
Successful: 218
Success Rate: 100.000%
========== DOWNLOAD ===========
Failed: 0
Fail Rate: 0.000%
Canceled: 0
Cancel Rate: 0.000%
Successful: 3616
Success Rate: 100.000%
========== UPLOAD =============
Rejected: 0
Acceptance Rate: 100.000%
---------- accepted -----------
Failed: 0
Fail Rate: 0.000%
Canceled: 22629
Cancel Rate: 45.291%
Successful: 27334
Success Rate: 54.709%
========== REPAIR DOWNLOAD ====
Failed: 0
Fail Rate: 0.000%
Canceled: 0
Cancel Rate: 0.000%
Successful: 1
Success Rate: 100.000%
========== REPAIR UPLOAD ======
Failed: 0
Fail Rate: 0.000%
Canceled: 603
Cancel Rate: 44.700%
Successful: 746
Success Rate: 55.300%
========== DELETE =============
Failed: 0
Fail Rate: 0.000%
Successful: 730
Success Rate: 100.000%

Your downloads tho…

in a word, flawless… i don’t understand how you can get 100%
even if we say your 1gbit connection beats everybody else and you are in a nice location for good fiber reach across the world… then you should still see like 0.250% to 0.350% or so failed transfers if running on IPv4, so ill guess you are running IPv6 only …???

========== DOWNLOAD ===========
Failed: 0
Fail Rate: 0.000%
Canceled: 0
Cancel Rate: 0.000%
Successful: 3616
Success Rate: 100.000%

the uploads cancelled are ingress and is usually caused by stuff like disk latency or low bandwidth
but if you are getting 100% downloads (egress) then it seems unlikely to be a bandwidth thing…
so my best guess would be Disk latency / backlog.

you could try to setup a write cache to help mitigate it, or add more drives depending on what kind of options you have… atleast as a temporary solution a write cache might do wonders… the raid might also not be configured to run great…

but yeah check your drives, make a temporary solution to try a ram drive write cache or add an ssd cache to the system to help mitigate it…

or try to shut down all the stuff you got running that you don’t need…

i have been stressing my drives due to resilvering (rebuilding drives) and i lost just over 10% of my successrates, and im running on 5 drives raidz1 (basically raid5) with an SSD cache on top
nearly got down below 70% and have been up at just short of 85% at best.

The node is just running about 12h, i ran the script before and indeed there were some failed transfers (about 3 when the node was running for some days) for download. As far as i know i am allowing for both ipv4 and ipv6 but i didn’t do any special configuration.
I will check with my hoster if they can implement a write cache.
Thanks for your inputs :slight_smile:

The RAM cache idea seems interesting too, because the ram is just idling there i will try and see if i can make it into a write cache

Doesn’t Linux use free RAM as (write) cache by default anyway?

yeah i would also think so… also i got zfs so it should do exactly that…
but i’m just not convinced that i’m seeing it working right… because if disk latency causes my ingress’s to get higher cancel rates… then it cannot really be going into memory…

right now i’m doing resilvering, but in like 24-36hr i should be done… then i will most likely try to enable asynchronous writes on my zfs pool… meaning that it should not care about writing only to memory.

with synchronous writes i’m not even sure it will accept l2ARC SSD storage, everything needs to be verified as written to disk before it will send a response that it has the data stored.

tried to disable it during my testing of zfs, but threw a few issues at me and i disabled it to be on the safe side. which is the default setting for a reason, and they say one most likely shouldn’t use it… tho it might be great for some database loads.

meh no time like the present, going to switch it now and will post the results tomorrow or the day after when i got some useful graphs and numbers.

no clue why that didn’t work, but basically just dropped performance another 30% on the storagenode…
i was kinda expecting that to improve how the system worked… because in theory the system is the allowed to write to RAM send the “gotcha” to the rest of the system and then leave it there until it flushes to disk.

maybe it’s the resilvering that caused it to perform poorly, but i figured if i’m testing it for performance reasons, i might as well check it during heavy load and for my little pool that is 600-900MB/s total read writes.

will give it another shot when the resilvering is done, but this doesn’t bode well, 3 hours and consistent 30% lower results and nearly immediately when i set my async back to standart, it came back up… to it’s mediocre performance it’s had for the last few days while i’ve been exchanging for larger drives in my vdev.

it’s presents two options… it’s not a disk latency issue… or async performance is greatly disrupted by the 600-900MB/s transfer or async affects something like L2ARC performance.
tried to check my netdata stats to see if that was the case, but apparently, netdata was just all blank during the entire test run…did come back just after i turned async back to standart.
so maybe something that could be mitigated by a system reboot.

i really need to switch over and try zabbix… netdata looks so nice, but it is just so kinda crappy when it comes down to really evaluating the data, and so full of bugs…

[30minutes later]

slams face into desk

async=disabled… needed to be async=always… apparently stuff works better when one pays attention to what one is doing…

Hey everyone, update since the latest update. What I can say is

  • Download is still perfect
  • Upload is decreasing further and further by update and update… Theory was that there’s uploads needed to be closer to the source so if it’s US here from NL it’s not good, but still feels it’s just going down…
    Any thoughts?

Hardware : Synology DS1019+ (INTEL Celeron J3455, 1.5GHz, 8GB RAM) with 20.9 TB in total SHR Raid
Bandwidth : Home ADSL with 40mbit/s down and 16mbit/s up
Location : Amsterdam
Node Version : v1.3.3
Uptime : 85h53m24s
max-concurrent-requests : DEFAULT
successrate.sh :

========== AUDIT ============== 
Critically failed:     0 
Critical Fail Rate:    0.000%
Recoverable failed:    0 
Recoverable Fail Rate: 0.000%
Successful:            1564 
Success Rate:          100.000%
========== DOWNLOAD =========== 
Failed:                19 
Fail Rate:             0.061%
Canceled:              11 
Cancel Rate:           0.035%
Successful:            31291 
Success Rate:          99.904%
========== UPLOAD ============= 
Rejected:              0 
Acceptance Rate:       100.000%
---------- accepted ----------- 
Failed:                41 
Fail Rate:             0.041%
Canceled:              73545 
Cancel Rate:           73.827%
Successful:            26032 
Success Rate:          26.132%
========== REPAIR DOWNLOAD ==== 
Failed:                0 
Fail Rate:             0.000%
Canceled:              0 
Cancel Rate:           0.000%
Successful:            595 
Success Rate:          100.000%
========== REPAIR UPLOAD ====== 
Failed:                0 
Fail Rate:             0.000%
Canceled:              2750 
Cancel Rate:           67.188%
Successful:            1343 
Success Rate:          32.812%
========== DELETE ============= 
Failed:                0 
Fail Rate:             0.000%
Successful:            57830 
Success Rate:          100.000%

I have more or less the same results. Still getting quite some data in though. But yeah I was close to 99% once

well your log covers the last 3½ days… which was when nobody was getting any data
such a log will look kinda bad…

Hardware : Dual Intel Xeon 48GB 2.13 Ghz 48GB with 30 TB in Raidz1 - no l2ARC found it to be slowing me down… for now
Bandwidth : Fiber 400Mbit
Location : Denmark
Node Version : v1.3.3
Date and log extent : (2020-05-05) - 24 hour log period
max-concurrent-requests : 20
successrate.sh : old

========== AUDIT ==============
Critically failed:     0
Critical Fail Rate:    0.000%
Recoverable failed:    1
Recoverable Fail Rate: 0.141%
Successful:            709
Success Rate:          99.859%
========== DOWNLOAD ===========
Failed:                30
Fail Rate:             0.677%
Canceled:              113
Cancel Rate:           2.549%
Successful:            4290
Success Rate:          96.774%
========== UPLOAD =============
Rejected:              10
Acceptance Rate:       99.945%
---------- accepted -----------
Failed:                0
Fail Rate:             0.000%
Canceled:              3815
Cancel Rate:           21.075%
Successful:            14287
Success Rate:          78.925%
========== REPAIR DOWNLOAD ====
Failed:                0
Fail Rate:             0.000%
Canceled:              0
Cancel Rate:           0.000%
Successful:            32
Success Rate:          100.000%
========== REPAIR UPLOAD ======
Failed:                0
Fail Rate:             0.000%
Canceled:              247
Cancel Rate:           18.003%
Successful:            1125
Success Rate:          81.997%
========== DELETE =============
Failed:                0
Fail Rate:             0.000%
Successful:            84712
Success Rate:          100.000%

This is from the 4th, only difference is that my array was doing a scrub or reconstructing a drive
after i got rid of my l2arc my ssd slog (write cache) is less strained and it has allowed me to if only serving storj on my server it can be stready about 85-86%

========== AUDIT ==============
Critically failed: 0
Critical Fail Rate: 0.000%
Recoverable failed: 3
Recoverable Fail Rate: 0.557%
Successful: 536
Success Rate: 99.443%
========== DOWNLOAD ===========
Failed: 103
Fail Rate: 0.860%
Canceled: 355
Cancel Rate: 2.963%
Successful: 11525
Success Rate: 96.178%
========== UPLOAD =============
Rejected: 20
Acceptance Rate: 99.979%
---------- accepted -----------
Failed: 0
Fail Rate: 0.000%
Canceled: 21102
Cancel Rate: 22.479%
Successful: 72770
Success Rate: 77.520%
========== REPAIR DOWNLOAD ====
Failed: 0
Fail Rate: 0.000%
Canceled: 0
Cancel Rate: 0.000%
Successful: 17
Success Rate: 100.000%
========== REPAIR UPLOAD ======
Failed: 0
Fail Rate: 0.000%
Canceled: 297
Cancel Rate: 21.475%
Successful: 1086
Success Rate: 78.525%
========== DELETE =============
Failed: 0
Fail Rate: 0.000%
Successful: 1701
Success Rate: 100.000%

only thing i do find kinda interesting is that if that is your log for 86 hours then you process like 2/3 of the incoming requests that i do in 24hr… which is sort of interesting…
i would have assume it was more evenly distributed… but ofc it may have to do with latency…
i think we really need a way to evaluate our server / storagenodes latency… because we mostly have to guess… or find it from using indepth system statistic logging software, and trying to interpret what it actually means.

Two things:

  • your upload success rate is almost 90%, mine is not even 30% - so that’s a big difference and I’ve seen it going down continuously. Could be that more SNOs with better connections are online but also traffic comes from and has to go to parts that I have a bad latency … sure - nevertheless worth observing.
  • The other topic is easy: I have to run two nodes on my NAS because my first one which is up since day one almost had a memory issue and swapped, I realized 20 hours later and then everything was ‘running’ but the uptime checks / data checks didnt reply properly / or in time. Hence I got disconnected on two satelites. My plan is to gracefully exit that one once all the parked STORJ are gone - so traffic is almost halfed, but as you say 2/3 as 2 satellites are not active on my older node

Well spotted! :slight_smile:

from what i can tell upload successrate is dependent of a couple of factors.

Bandwidth and latency, last but not least…

Bandwidth isn’t that important only if you are handling more requests than your bandwidth can keep up with, and even my connection barely exceeds what yours can do… so lets disregard the bandwidth, as a factor but not a deciding one.

*Latency becomes a very complex subject, but lets disregard egress, as most have little trouble with that.

What does the Ingress latency consist of… first the internet connection type… gear and what not, which most of the time will be a fixed number… or fairly static, locally i get like 5-10ms, so lets assume since we are pretty in global geographic terms that we both are even in latency to different points in the world.
thus you DSL or whatever broadband it is… is on wires not fiber and thus latency generally higher.
maybe 20-30ms.

so now we ingress to the local latency, which on even a strained local network your latency would be 1-5ms so basically nothing of note, we hit the storagenode host and then everything speeds up because now we go from semi long distance signalling to short or micro distance super high bandwidth and thus lower latency… and before anything we can explain moves we are at the storage medium. HDD / SSD / NVME / DRAM(raid card) i know nvme isn’t a drive type… but not sure what else to call it.

HDD : 7200rpm seek time 6ms (if idle) grabbing this from memory, might be slightly off…
10k rpm seek time of 2ms… basically the faster it spins the lower the seek time, so 5400rpm owners be aware… but ill assume a 7200rpm since its the common affordable version, while 5400rpm are more mobile / external use cases.

my 7200rpm drives can during heavy loads give me a backlog in netstat( which i’m not sure how accurate it is… but i’m sure its bad enough that its relevant.
1200ms backlog, meaning if our data stream arrives in this case, then it may in theory be stuck for 1.2seconds before the acknowledgement is sent all the way back that the data to lets say from us to the united states which is like at dsl maybe 70ms and on fiber maybe 50ms

making it a total round trip of 1.3sec or 1300ms this means over 90% of your bottleneck in latency is in the storage array and it’s ability to deal with IO of the incoming.

sure if the drives are idle, then 6ms or less is a great time… a 7200rpm at moderate use gets like maybe 100ms easy… in backlog… so even at the best of times… with the node running your hdd latency is the primary factor…

so what does a petty 100ms or 1.2sec do… well lets see…
a 40mbit ingress connection will be able to transfer about 4.8 MB/s
and each file is 2.2MB so not even a second to respond…
and then you still get the request have to start working on it, then cancel it, wasting bandwidth and IO
causing more latency.

if you however wrote directly to a write cache, then it will fill slowly, get flushed to disk and a sequential write and thus reduce IO and throughput over all, and it would keep your latency down… way way way down… even if your hdd raid was at 1.2 sec backlog… a dedicated write cache would take the data (if in case of a modern semi idle low grade ssd in a few ms) and send the acknowledgement that the data is on disk…
essentially your system may download 100% of the file, but fail to committed it to disk fast enough and thus loose the race because of it… i duno how often or if this happens, but in theory it could…

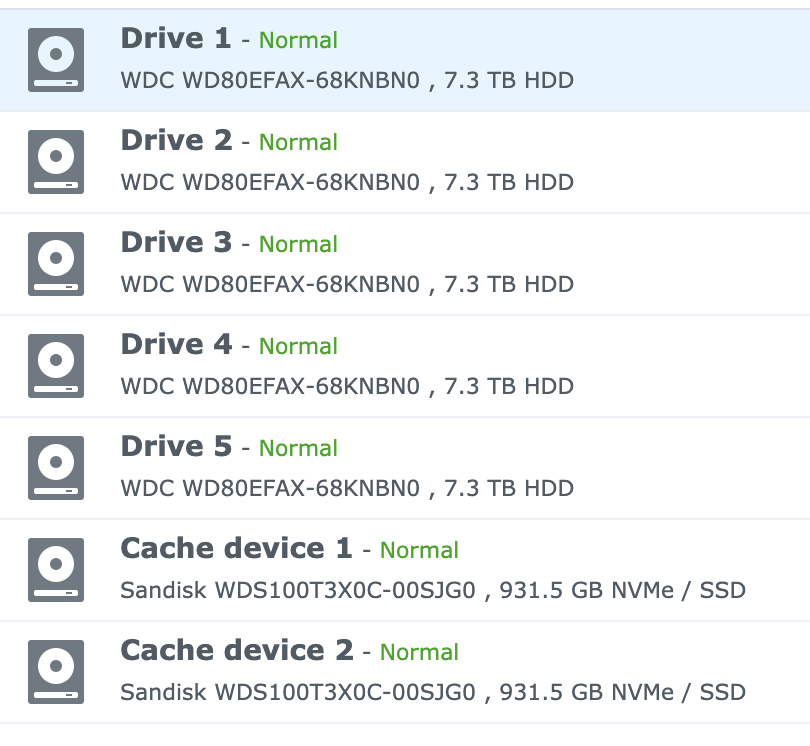
make yourself a write cache… you can most likely just install some software and dedicate like 512mb ram to it at first… or install a space little ssd. or just make a partition on a ssd drive you already got … just need like 1gb and some software to make it into a write cache for your storage…

try that, any type of non hdd write cache would most likely do wonder… because disk latency is the name of the game… atleast at first

i think i’m at 10-20ms peaks with my ssd write cache, most of the time its less tho…
anyways downloading some software for it is free… and you can just use ram for a test… so only wasted thing is time if it doesn’t work.

good luck
on a side note… maybe the success rate is split between the two nodes… tho i duno… i only plan to run one massive node, so not really relevant to me…

1 Like

Here is where your post goes sideways…

A volatile memory cache is not a good idea for SNOs to implement. In the long run, such cache is going to fail at some point, power failure is going to happen, a child running around the room playing with a ball inside due to some quarantine rules is going to accidentally pull the cord on the computing platform, lightning is going to cause a power spike and the discharge is going to corrupt the cache silently… the failed write to disk but captured data piece is going to lead to failed audits latter and finally disqualification.

A slowly filling node is not a problem. SNOs should not try to “fix” something that’s not broken, unless they want to greatly increase the chance of disqualification.

1 Like

Moving the databases to a dedicated SSD would definitely improve performance without compromising data integrity.

Yesterday i found that updatedb.mlocate was a performance I/O killer (99.9%) . It’s enabled by default and CRON launched at times on Ubuntu 18.04LTS, , hence i killed this process and disabled it. The OS has no need to index the nodes files for future file research. I’m maybe wrong but it made a huge difference on my system.

1 Like

This is an OS issue… not a configuration or hardware change specific to Storj.

OSes configured in Desktop mode are going to have performance problems. Gnome has tracker issues as well… I turn off all those indexing services even on my Desktops. I have philosophical issues with a DB containing metadata of every file I have sitting in all directories on every computing platform I run… And such services slow down the whole OS…

yeap, i know it’s not specific to Storj, but since it has a huge performance impact on node, i just wanted to share it for Ubuntu SNOs :slight_smile:

I share your philosophy, and also disable it on all my computers. I know where i store things.

1 Like

The RAM suggestion wasn’t meant as a fix, but as a test if a write cache would fix his issue…
but yeah you are totally right…

i did also suggest to use RAM as a test,.

Tho in rereading my post i can see that i don’t state it clearly enough that its no long term solution and that it does essentially come with some risk even just for testing it.

30% successrate tho… is so low i would say his setup is broken, one could in theory then need to download 3 times the data to get the same stored data on a node… which is an over all detriment to his local internet, the internet ingeneral, his isp and also add tons additional IO load on his system.

@buchette
yeah there are an aweful lot of files in the storagenode data folder, if people are running like 5x 20tb hdd in a raid they might exceed the limitations on their files system, indexing or antivirus scanning it, is a big mistake even on single digit TB storagenodes.

i don’t think the databases are the big issue people make them out to be… i mean in the enterprise people work with databases the sizes of TB and up in some extreme cases.

i should really read up on how big databases needs to get before it becomes an issue working with them…

Thanks for all the replies, even though some of it goes a bit beyond.
In general:

  • I don’t believe my setup is broken
  • You can see all the details above, but will repeat here:
    Hardware : Synology DS1019+ (INTEL Celeron J3455, 1.5GHz, 8GB RAM) with 20.9 TB in total SHR Raid
    Bandwidth : Home ADSL with 40mbit/s down and 16mbit/s up
    Location : Amsterdam
    Node Version : v1.3.3
    Some more details, so you can see which model it is. And I have the SSD cache enabled which (I thought) was helping in improving download. Even though the specs of the HDDs are “Western Digital Red 8TB 5400RPM 256MB Cache SATA 6Gb/s” so with 5400 RPM ‘only’ I can’t believe that it slows down anything in the setup.

Reson is also:

  • download is almost at 100%
  • My assumption was writing takes more time than reading, as writing works nicely, reading shouldn’t be an issue (not only because of the SSD Cache)
  • So hence I though it’s latency… but why is upload different than download then?

There’s one piece that could have been a bottleneck which is between the NAS and the router is a Devolo ethernet over power (not sure how it’s called in english) and it’s a Devolo pro 1200 dinrail … and it brings constant 250mbit/s in both directions and no PL or anything… So my take was this is not an issue either. And if - wouldn’t it be for both, up and download? :slight_smile:

Also back in the days upload was much better, just decreased slowly over time… so it was pretty ok before.

Questions over questions.

I don’t think your system has anything wrong with it, its your internet connection Adsl with only 16mbit upload and 40 download is your bottleneck. If your doing anything other then running storj on it its going to affect you node directly.

Yeah I’m also pretty sure that the connection is the issue … even though it’s not used. I was away for the last 3 days from the statistics and it didn’t help at all… so even if there’s no netflix /whatsoever (which actually doesnt show any decrease in storj traffic) as it seems there’s enough space left.
Or my provider has more issues due to COVID traffic consumption overall? Nevertheless - I haven’t seen any higher ping for instance.

It could be that theres more people using it cause its shared bandwidth, But just overall I remember the bottleneck being when uploading its going to slow your download down to I dont remember them making Adsl with the ability of uploading without effecting download speed. You could run a simple test of running upload and download at the sametime and see how stable it is.