on the 16th I lost a lot of online Audits for my US1 Satellite and have so far not been able to identify why exactly I lost them as my system seemed to be running fine otherwise.
When checking the Storj Network as a whole I saw a sharp increase in suspended nodes starting right around the time frame I experienced my missed audits.
Is this a known problem? Could there have been some hiccups on the side of the satellite or should i invest more time into my personal setup to find out what made me loose those audits?
I haven’t been missing any other audits since that timeframe so far. The one lost Audit from the 15th could well have been as I had a short reboot of ~5 minutes during that time.
All good on my end. Maybe whoever fired up those 2000+ nodes overnight realized they made a big whoops?!? As for your issue it wouldn’t hurt to look it over quick if your failing audits. What kind of setup are you running? Maybe a disk going bad or something?
I am indeed using a free service but its none of those seeing use by other people in the threads I have read.
I am using one from Asus that is managed by my router.
I also monitor my storj nodes via Uptimerobot and they didn’t report any problems. I would assume if it was a DDNS Problem they would also appear every now and again saying they can’t reach my Server?
I could however also choose a number of different ones from my router. Or even go to my Domain Hoster (Strato) to get DynDNS going it it actually turns out to be the problem.
I am running my Nodes via Unraid. I have added a new disk lately but that only caused a few minutes of downtime on the 15th. The server was running happily during the 16th where the audits all failed.
I have in the past had some problems with my node not starting up again when updating that I have fixed. During those times I always got a notification from Uptimerobot that my node was not reachable. But this time around I got no notification.
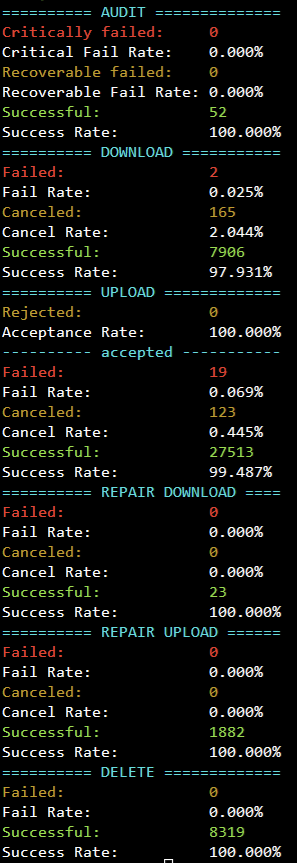
Running Successrate.sh I get a fairly good score currently and my Unraid reports happy smart values on all disks so I do not think that is the cause:
europe-north is just so low as one audit failed. Also the other failed audits are all sensible and happened during times when I did work on the server and a audit could have happened and failed.
Its just the 8 failed Audits on the time frame of the 16th 0 - 12 that bother me.
Could you maybe help me with the ERROR / WARN checking? I use the command “docker logs storagenode-v3 | grep ERROR” to get the errors but it does not go back far enough to see the whole of day 16. Is there a way to tell it to show all errors in a specific timeframe?
Oh, your audit score is fine. Your uptime is the issue. Now this is something that does happen to me from time to time. Even though everything on my end is totally fine sometimes the online score drops randomly on different sat’s. No idea why but they always recover.
No, it should bring all entries available. This suggests your node restarted and that’s why the logs only start from the middle of the 16th, assuming you’ve not redirected logs. So your node may have been offline at that time??
Also please try to be accurate with terminology - you haven’t failed ‘Audits’ your ‘Online’ score is affected by the node being offline/uncontactable.
Alright, logs are deleted if the node restarted.
Can I change that somehow?
Seeing the uptime of the docker confirms that. I assume this could have been during a update of the docker. Uptime robot didn’t detect any downtime during that so the downtime due to that should have been below the 5min checkup period. Weird to have 8 online checks not work during that time.
So a online check != audit?
From my understanding up to now a audit is at the same time a online check. You can fail a audit by delivering the wrong answer which would also decrease your “Audit” Score. But another way could be by not being online during the time and not answering at all. In that case you would not fail the audit in terms of decreasing the audit score but your online score would drop.
Or are there separate things that happen to do Auditing and Online Checks?
I have been using the Terminology provided by the statistics that StorJ provides:
They call this section “audit” and within is a “Audit History” and then in there are the different windows. I have a total count and a online count. And my online score is affected if they don’t match up. If no “audits” are done then my online score is not affected as nobody noticed the downtime.
Or was the problem just me calling a audit that didn’t count towards the online count as “failed” when it was not failed but just ehm idk delayed? How would I call those correctly? Not Failed but … Audits / Events?
good to know that it can sometimes just happen. The actual downtime on that day seems to have been below 5 minutes as Uptime Robot didn’t say anything happened on that day.
Of course a underlying problem that is only regionally affected or lots of small timeouts that just happen to be between the check periods and never during the check could have affected it.
As you can see it didn’t detect anything on the 16th. And the 3 actual downtime’s where all short ~5 min downtime’s that actually happened due to me restarting my array to change array configurations.
Might have to let a service check my system for uptime across different parts of the world to see if maybe my DDNS is the problem. I think I’ll just keep an eye on how the values do over time and if its a one time occurrence I’ll just ignore it. If it happens more often I will have to look into it more.
Audits do serve as online checks too, but if your node appears offline, only your online score decreases, whereas your audit score decreases only when your node does respond but with corrupted data, no data (file not found) or if it times out despite being connected to the satellite.
It’s not supposed to happen often though. All of my nodes are above 99% (online score) most of the time.
Keep an eye on your scores and ensure they stop dropping. If your connectivity issue is solved, these scores should stabilize for a few weeks and recover by 30 days.
If scores kind of keep dropping, you’ll have to investigate further why sat’ struggle to reach your node while uptimerobot doesn’t.
Recently had issues with my DynDNS (as @Stob said) and even though saltlake couldn’t reach my nodes, uptimerobot could not see anything wrong, for weeks.
If your scores keep going down and nothing else seems suspicious in your logs, maybe worth trying out another DynDNS.
I’ve had cases where I’ve started up a few new nodes and after a few days one or 2 have shown substantial downtime for no apparent reason. There was no actual downtime and the rest of the nodes were fine all at 100%. Curious if anyone else has ever experienced this?
We do not have such recommendation.
But we recommend to use an older Docker desktop for Windows, if it’s impossible to use wsl2 engine for some reason.
Thanks for far for all your answers. I really do love that this community is so active and helpful.
Anyways I have sadly gotten one more missed Audit since first reporting the problems.
Again with US1 but to be fair maybe the problem is not local to this one satellite but rather just due to the fact that this satellite holds the most data and as such has a higher frequency of online checks.
Uptime robot has continued to not show any problem what so ever with this node. In its default setting it has a timeout of 30 seconds though. I have set up a second monitor with only a 5 second timeout to see if that might be a problem.
Does anyone know how long the “online check” part of a audit is timed out? As far as I have read it is 5 minutes for the audit itself. If that was the case Uptime should have caught the port monitoring…
I have found a problem with my docker logs that I will look into that cause them to be rotated out and deleted after a while. But with what i could scrape together out of 2 different logs I get the following:
Total Errors: 45
Timeframe of Errors: 18th 14:00 (2pm) till 19th 12:00 (Noon)
Upload Failed: 27 / 45
Download Failed: 3 / 45 (connection reset by piere, closed network connection, content deadline expired)
Could not send delete Piece to trash: 1 / 45
Service Ping Satellite Failed : 14 / 45 (across multiple satellites and always “tcp connector failed, connection timed out”.)
Full Error Messages (without Upload Failed) can be found here: https://pastebin.com/XXX (Edited out)
I do not know if those Satellite Ping Errors are to be expected or not. Maybe someone can give me some insight if those could be related to the problem by comparing the occurrences with their own setup. The dial TCP shown is my correct public IP but I am not sure if it is showing my node contacting the satellite or the satellite connecting to my node
Btw if you are using free version of uptime robot free version i think it checks every 5 minutes, so it might have been down for less than 5 minutes multiple times.
Thanks I do plan on setting something like that up on a remote site in the future. But that remote site is still in planning.
I could however set this up internally and just monitor my services with it to see if I can detect outages outside of network related issues. So thanks for bringing it up. If my services report downtime on a internal pinging heartbeat then something local to the storage node should be the problem. If it stays up and the outside collapses then something on the network side must be problematic.