I just got my first suspension emails quickly in succession for node 12aUqCwr3HgycsHYpdqjAKPj1Y1DHFqnU3ujNwJcChspbgqD2nr
After checking the forums I found that the issue was that I was failing audit downloads with a “usedserialsdb error: database or disk is full” error code.
I restarted my node with
docker restart -t 300 storagenode
and audit downloads appear to be completing now.
Before restart the last 300 log entries were all failed downloads (GET, GET_REPAIR, and GET_AUDIT) with the error code “usedserialsdb error: database or disk is full”.
I am confused at that error because my 1TB node has over 400GB of free space according to the browser based GUI dashboard:

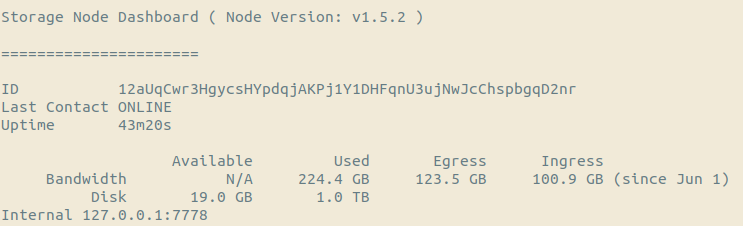
However the CLI dashboard tells me that I have 19GB of free space:
With the suspension and dashboard discrepancies I’m wondering if my node is degrading somehow. Are these signs that I should be doing some kind of maintenance or graceful exit on my node? Any advice on how to keep from being suspended again in this way?
Thanks so much.