Hi, just a note here. The documentation says that to stop a node, SNO can do docker stop -t 300 storagenode. From my observations 300 seconds is not enough if there are very slow connections. I’ve observed node shutdowns taking even half an hour. And if docker kills the process, databases may end up in an inconsistent state. I bumped it to two hours, just in case.
it never took more than a few seconds for me.
How big is your node?
My ~6TB nodes on external SMR drives only need 2-3 seconds to shut down…
Same here, just a few seconds at most. Long transfers are normally closed. The node just waits until they are neatly closed. It doesn’t wait until all open transfers are done. I think you may be seeing another issue on your node if it takes this long.
Got several of them, the largest is 1TB.
It routinely takes tens of minutes here.
External SMR drives are not made equals.
-Seagate expansion 4TB (STEA4000400) works very well even filled, i have 2 units.
-Toshiba Canvio Basic 4TB are just horrible disks. I had db locks, it took ages to stop the node, I/O @100% constantly, you get it.
I am also using Seagates ![]()
Had another case of a long shutdown.
+ docker stop -t 36000 storagenode-chomik7
storagenode-chomik7

real    418m34.723s
user    0m3.745s
sys     0m0.616s
Had to kill it manually. The node is on a ST6000VX0023 drive together with some other nodes, a total of ~4.5TB in Storj data and another 0.5TB in other “data collecting” activities. The drive is now connected over SATA to a HP Microserver N36L.
Are you running multiple nodes on one SMR disk?
Multiple nodes yes, one SMR disk no. ST6000VX0023 is not SMR.
Was just wondering that the load from other tasks on the same disk would have a bad influence on your overall performance of that drive.
If the drive is saturated with activity, performance will vastly decline, which could cause such experiences.
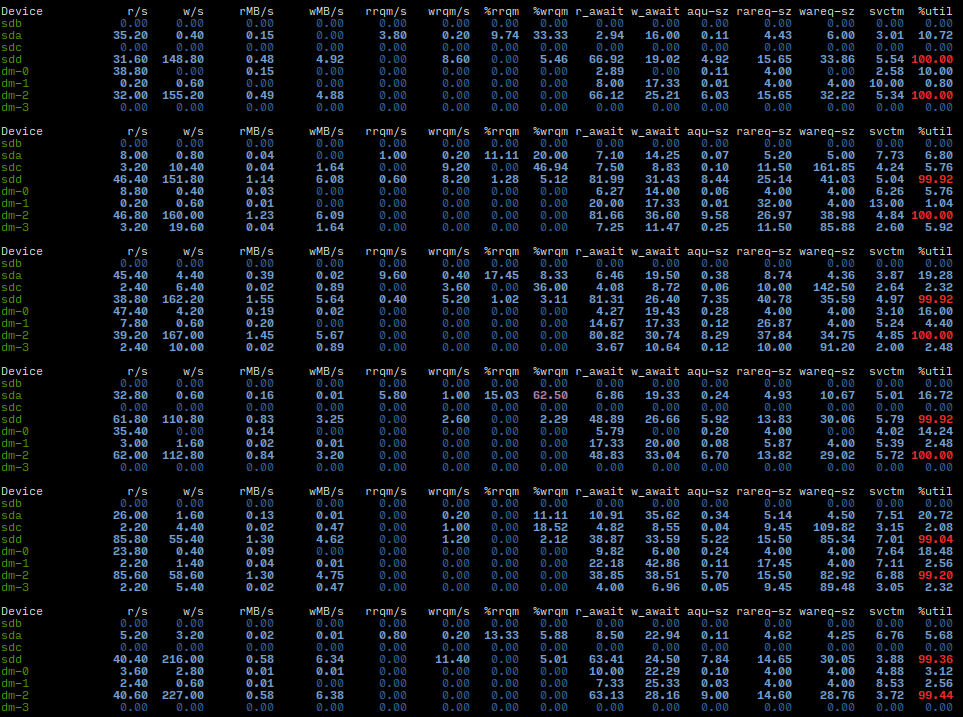
Did you look into the total load of the disk in IOPS while trying to shut down a node?
I tried, but I admit I don’t know how to interpret the results of iostat/iotop. What I certainly noticed is that if I temporarily set max concurrent connections to a low number, I never had this problem. It only became a problem when I increased it to 500.
Well… two things:
$ iostat -dmx 5
This will give you the running avg usage details of your disks.
Look for:
r/s - read ops per sec
w/s - write ops per sec
right most column, is a calculated indication in % of drive busy
First two can be combined for total drive IOPS.
500 is a very large number… if you are to use this setting at all, use low sensible numbers. It’s a limitation setting, it can’t force more traffic to your node if you set it high ![]()
Thank you, this is what I was missing!
This is the normal operation of the system, and I deliberately started stopping the same node again. The drives that host my nodes are /dev/sdc and /dev/sdd, the latter being the one with 4.5TB of Storj data.
It’s mostly because at some point I had thousands of connections… and it took more RAM than what I had in this system. Besides, I believe that just like every queue in a distributed system should be bounded, every resource should be limited if reasonably possible, even if the limits are way higher than what a healthy system should request.
It’s busy alright ![]()
Do remember that a node does perform a HUGE read cycle at startup. It could take up to an hour+ for a large node to complete the startup burst.
Limiting things… sure. Makes sense.
Have fun with your investigations and tests!
It might have been a mistake to format these drives as btrfs… I think it might amplify writes.
Not too experienced with btrfs, but ext4 works well ![]()
However I wouldn’t expect great performance if anything like compression or autodefrag was enabled ![]()
I have two 4TB nodes on btrfs and they work fine. Just keep your sqlite databases defragmented. (Vacuuming them regularly will do this.)
Can you perform this on a docker node and how? Also which DB’s?
