Test new downtime tracking system

A few months ago we implemented a new downtime tracking system. You can find the reasons and how it works here: Design draft: New way to measure SN uptimes

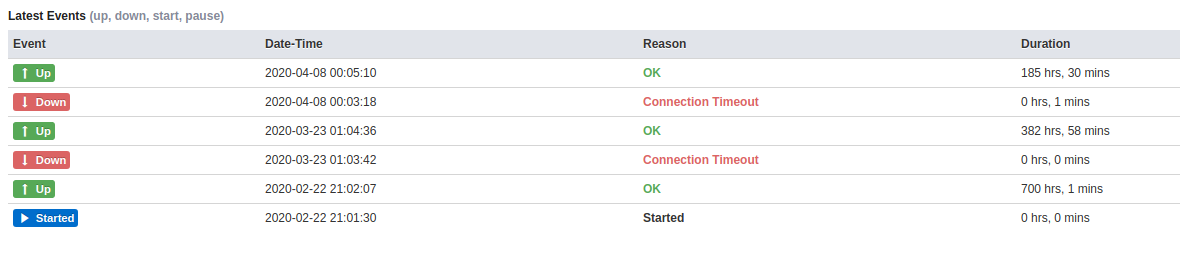
The new values are not displayed anywhere. So please forget about what the storage node dashboard is currently displaying.

Now I would like to double-check the values in our database. I need a few guinea pigs for that. The plan is that you tell me your nodeID and I will look up what the downtime tracking system has registered for your nodeID. Hopefully you can tell me if these values are correct, incorrect or you don’t know for sure but you still think it is incorrect. This makes especially sense if you notice that you had downtime and can even see in the storage node logs how long the downtime was. These situations would be perfect.

The results will look like this:

node_id tracked_at seconds
f2a3b4c4dfdf7221310382fd5db5aa73e1d227d6df09734ec4e5305000000000 01/25/20 16:58 893
f2a3b4c4dfdf7221310382fd5db5aa73e1d227d6df09734ec4e5305000000000 01/30/20 17:12 719
2 Likes

It’s a bit difficult to count that from logfiles and I don’t have all log files anymore but I have data in prometheus for >6 months. So if someone can tell me how to extract the time where no data is stored within that timeframe, I could probably easily tell you how long my node was probably offline. (didn’t have any relevant internet outage so only hardware offline time).

My logfiles only reach back 31 days.

I did have downtime when I was upgrading my nodes hardware.

I would happily try and help out. I am not too sure on my exact downtime, but it has only been for the updates (about 1-2 minutes each) and one reboot in the last 70 days (10 minutes according to logs). So if that kind of accuracy is helpful to you, here is my NodeID: 1F4dnzimiErEE5diN7PyvUGZY7hpVMcDq74XnaAeY6KvB5Yp2f

12jLCxrJzt4qw4ht9bD1jiCw4mYNx8qVPLyFoD7UwTcFc5Mxs3x

12AuK25mZf7VEM67gtNea7ZU2QVqvcZF4cQVN1JoCaBn3mfoRRp

Uptime robot says my uptime for the last 30 days is 99.827%, though it looks like it ignores my second connection (or my dns update script is broken)

12Y6LLo5WuVyifZ9v8TzcWECW19YwJtUGBf6MwcU6bgGZBfwtiL

Lets give it a go!

15RGP7Pdx3U6buCqq2Fb5gqfo9pqZ722e29AP6eeUKaSHVsbBb
Unfortunately i have above 4 hours of downtime in the last 30 days .

12aYrWFmJqrmhN3zgkvANBTsj2DdLwf2aZC8T5t7CrNazHahKXW

Uptime has been pretty ok for me until my ISP had me bring my old modem to get it replaced… very annoying. Still managed to keep downtime limited to 33 minutes… I was rushing… a lot, haha.

Last downtime was more than 30 days ago though. I don’t know how far you’re looking back?

1 Like

12EEcfwBgnh6K5t1CtSHDyoauLaJ4nAsWPs9Z2zNJ7tvzdZBhhU

4h 41min. downtime (disaster at night)

1 Like

NodeID: 1uiBijz7HDGa8j71mwD5yPehWG6cjLYZsY71ywQhMiZfA7zN4T

From Node-Log:

2020-03-01T09:05:49.343+0100 INFO Configuration loaded from: C:\Program Files\Storj\Storage Node\config.yaml
2020-03-01T09:05:49.928+0100 INFO version running on version v0.33.4
2020-03-20T20:28:37.697+0100 INFO Stop/Shutdown request received.
2020-03-20T20:28:45.308+0100 INFO Configuration loaded from: C:\Program Files\Storj\Storage Node\config.yaml
2020-03-20T20:28:46.698+0100 INFO version running on version v0.35.3
2020-03-30T22:59:57.079+0200 INFO Stop/Shutdown request received.
2020-03-30T23:00:02.118+0200 INFO Configuration loaded from: C:\Program Files\Storj\Storage Node\config.yaml
2020-03-30T23:00:03.578+0200 INFO version running on version v1.0.1
2020-04-07T21:59:58.494+0200 INFO Stop/Shutdown request received.
2020-04-07T22:00:03.527+0200 INFO Configuration loaded from: C:\Program Files\Storj\Storage Node\config.yaml
2020-04-07T22:00:04.958+0200 INFO version running on version v1.1.1

From UpTimeRobot-Log:

Up, “2020-03-15 08:06:25”,OK, “752 hrs, 11 mins”
Down, “2020-03-15 08:04:47”,“Connection Timeout”, " 0 hrs, 1 mins"

DownTime

2020-03-15 98s ISP Link Down
2020-03-20 8s Storj Update Version
2020-03-30 5s Storj Update Version
2020-04-07 5s Storj Update Version

StartDateTime: 2020-03-01 09:05:49
EndDateTime: 2020-04-15 18:08:40
https://www.timeanddate.de/datum/zeitspanne-ergebnis?d1=01&m1=03&y1=2020&d2=15&m2=04&y2=2020&h1=09&i1=05&s1=49&h2=18&i2=08&s2=40
Sekunden: 3920571 Sekunden / 116 = 0,003% DownTime

12aHfaAZkEtVAwxzXPkrioxnfFJRwW3M5JPhGmHB5xxJN4cXrLv

Estimated Downtime: For 2020 31min (Last Downtime 05-03-2020 00:16 1min)

1SX6nSo3uxSuVQYowejqL4FsDgnhiFDY9YgCDqm6cCoxHWW6H1

Estimated Downtime: For 2020 17min (Last Downtime 28-02-2020 10:23 16min)

*Uptimes from UptimeRobot.

VPS-ID: 12NzdcukztXxn7VTq3zDo55LFpyT5faee7qoknvzUkyfV88sX32

VPS-ID: 12UWMojwho7BMY5RgDL84MP9bmCf2AAndWUv74g1F7i3NVhKmTB

VPS-ID: 1Bp1p5U3unNvfVPXQvao66XTEwdzMZQdSdsyZSw8ucEZLTbwW3

Pi3-ID: 124eHsMpQKiD7Xa5fNCBPEFY5rqsQ8WyAw3rjBHUFPKAqFcBTv8

1wpACsn7K84XDenzvXBKnpyW5vzgeQFSBhPJAjdAeJQ5FXbNux

12pqfk9a1Z8SwwXsHBfiSb8p7dxqYqFQJYqxVGR7ZWr6YvZ8GeN

1iQdpZFg4CrkWM5yjwbpgiTx5rhibuTcLVEYNfwn96CPjx4raw

12GgvCTjG8ggDCLiPVsLBUYA7hwzgJVFtdHcWCrS7rwNKQUC4bw

@BrightSilence which software are you using to track downtime and uptime of your nodes (CD screenshots you sent)? Thanks


You can setup alerts with the mobile app as well! It’s very useful.

2 Likes

With a downtime of less than 1 hour, you might be lucky that the satellite didn’t notice it. I can see only all 3 tardigrade satellites that you have been offline in February?

tracked_at seconds
02/06/20 03:00 2,035

I see no downtime at all for your nodeID. That is a good sign :slight_smile:

Seems pretty good the amount of downtime I have seen is pretty close Didnt think It was down for very long though but it was planned downtime for me was upgrade OS drive to SSD.

The satellites haven’t notice it. That is not a good sign. Are you sure?

No downtime in the database.

Ok I guess I will just skip everyone that has only a few minutes of downtime…

1 Like