My API value of storage used fluctuates. The API is currenty half of the displayed “used” amount in the dashboard. Here is a graph showing the api value changing.

I have more instances, but logs do not show anything of note. Here are 30 days of the fluctuations:
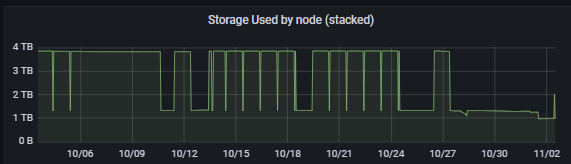
Here are 6 months:

Note: i am currently gracefully exiting some satellites, but not all, and this was happening before i started the process.
Could you please show the storagenode dashboard?
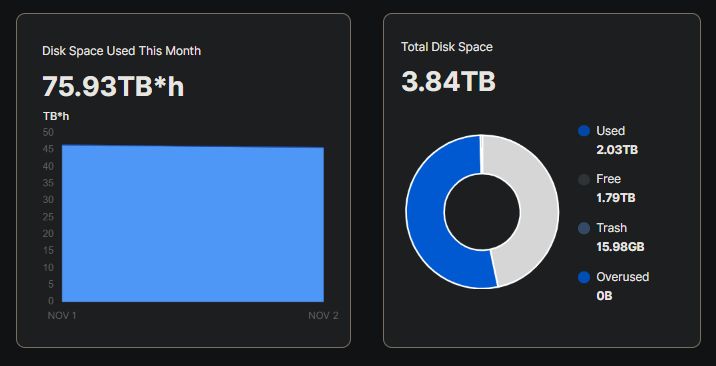

I do not see a big discrepancy between the satellite point of view (75.93 TB*h for 2 days) and storagenode’s point of view (2.03 TB). Perhaps your node were offline and some data is not deleted right away. It will be finally collected by the Garbage Collector.
I cannot help with your monitoring setup though, but maybe someone from the Community could help to figure out, why your monitoring missed some data. The dashboard uses the same databases as an storagenode’s API.
Is that Prometheus + Grafana?
All of the info i get in the dashboard makes sense. It all fits. Its the reported per satellite used storage that isnt shown on the dashboard that is fluctuating down to 1.33TB(or now lower) and back to its real number. Heres the same thing from may:

As far as current info,
This is the dashboard:
Here is the api data:
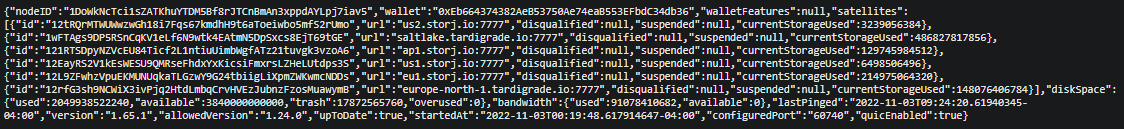
and heres my addition of the satellites storage used compared to the total storage used being reported.
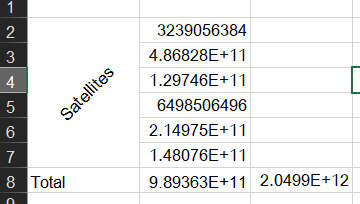
The 989GB is the sum of the satellites used storage, and 2049.9GB is the reported total used storage. This is the discrepancy. Ill see if it fluctuates back so i can show the api data at that point. I dont think garbage collection goes in reverse as in my graphs it comes back up.
I think i got something. The api data above shows that US1 has 6gigs. Here is the dashboard for us1:

it shows 58.59TBh for this month so far. At 6gigs it wouldnt have hit half a TBh yet.
Yeah, but its scraping the api data. Thats the source of the issue.
Sorry for the walls of text and graphs. I just want this figured out.

Thanks for the data and for bringing this to our attention. I’m going to discuss this issue in our stand up meeting this morning and see if anyone else has seen this issue and see if there is a ticket in the system already. I’ll follow up later in the day but If you happen to catch any error messages, either in the browser console or the storagnode please feel free to include it.
THANKS!! I looked through the logs and couldnt see anything but uploads and downloads when it happened. I can provide logs tho.
Any update on this? I just had it drop from 1.33TB to 604KB after a reboot. Im looking for logs now.
WE HAVE LOGS:
2022-11-20T12:12:21.076-0500    ERROR   blobscache      satPiecesTotal < 0      {"Process": "storagenode", "satPiecesTotal": -46848}
2022-11-20T12:12:21.076-0500    ERROR   blobscache      satPiecesContentSize < 0        {"Process": "storagenode", "satPiecesContentSize": -46336}
Maybe not helpful from a debugging standpoint, but proves that theres a rather big problem if its saying theres negative storage.
P.S. I also noticed that it reverted to the accurate number at the last second of a filewalker process done at the startup of the node.
P.S.S. I just restarted the node and at the last second of the filewalker it reverted to the accurate number. It seems like something (maybe the node itself) can cause all satellites to think this node has a very small (sometimes negative) storage used, and after a filewalker (or randomly a while after falling) the node gives the satellite the real value. All day today after a reboot (testing things), it would register as some small/negative number for the storage used for all satellites, then after a while, or after the filewalker ran, it would revert to the accurate number. Sorry for the wall of text, just want all symptoms out there.
Filewalker runs not only on start, but during the day too
--storage2.cache-sync-interval duration how often the space used cache is synced to persistent storage (default 1h0m0s)
Correct, but it would revert sometimes without the filewalker running.
Were you able to find anything? This still happens every time i restart the node. It has a negative amount of storage that grows, until the next filewalker runs, and it goes back to normal.