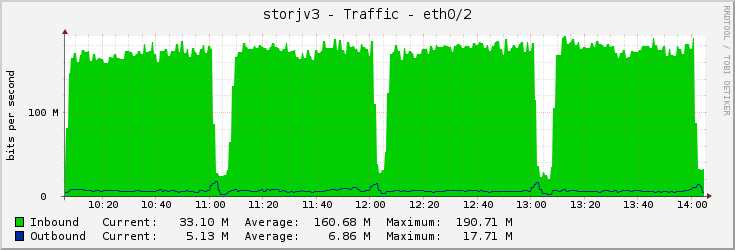
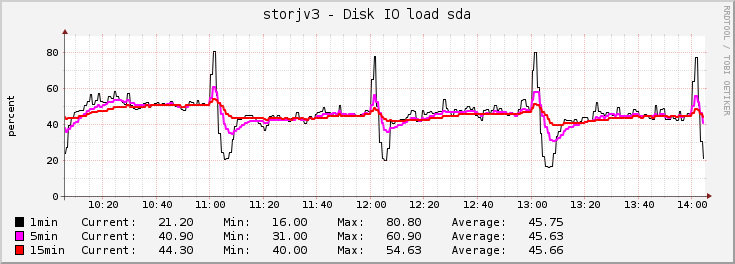
3 shared nodes getting about 200Mbps, 40-50% CPU, 10% disk IO pressure, no netdata alerts
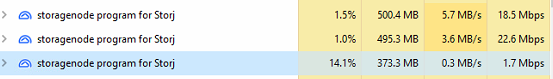
for some reason my cpu usage not consistent across nodes.
some working on 1-2% cpu and getting traffic 20-30mbit other taking 13% of cpu and get only 13mbit so i really not understand why it so big difference. RAM usage is normal.
I love the utilization on my 1 Gbit bandwidth. But I spotted, that my disks are too slow. Time for more disks.
Probably difference of disks? I especially see CPU and RAM usage on the nodes with SMR disks.
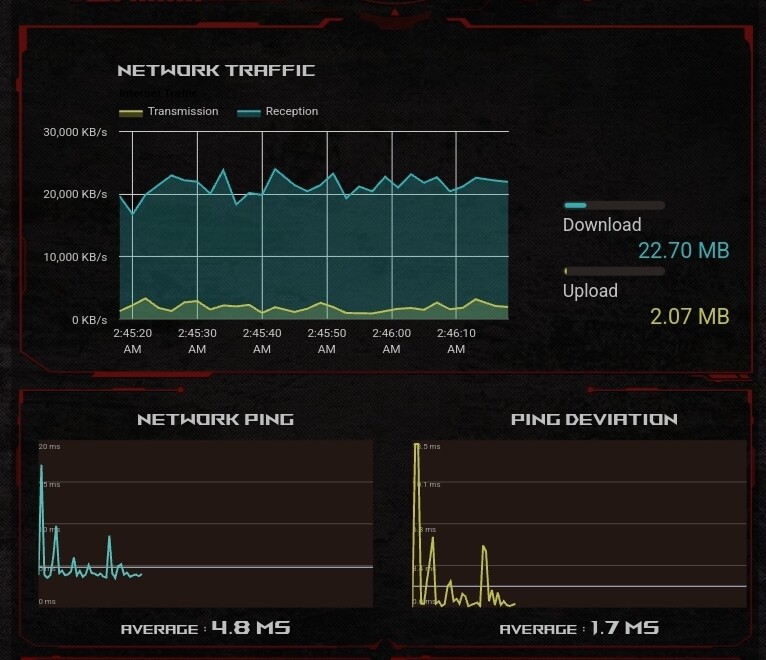
I’m not near saturating my bandwidth…
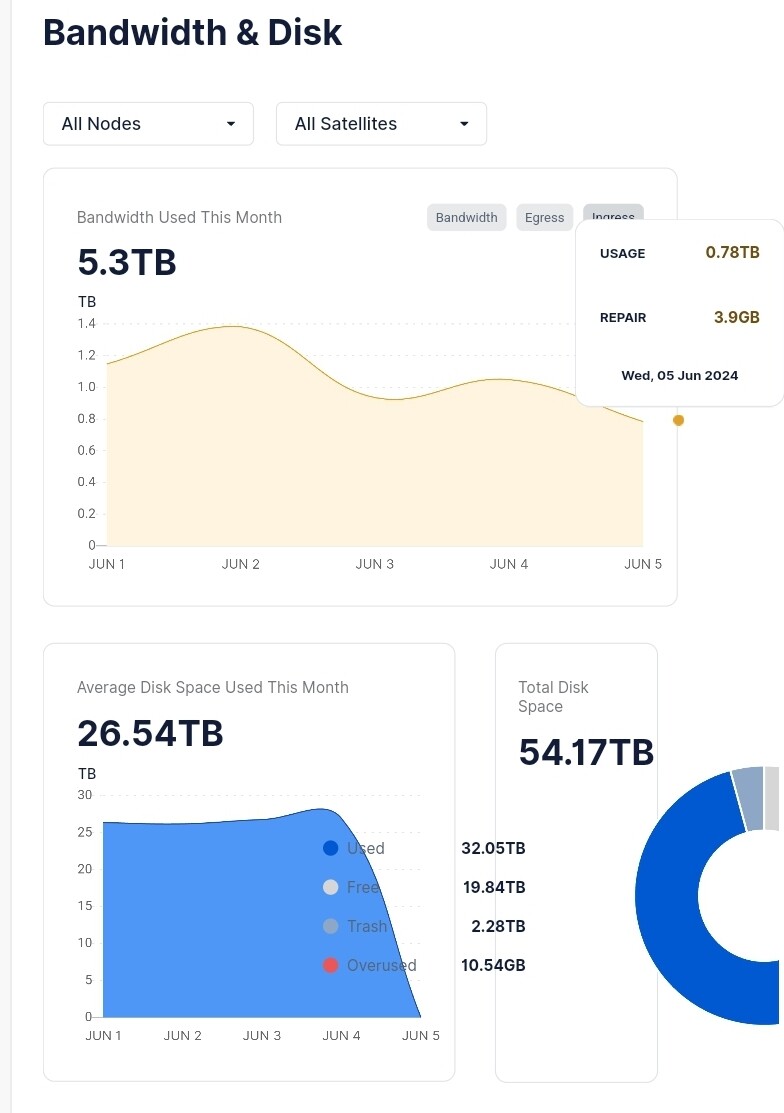
But now already almost same ingress as yesterday, with still 18h to go. So I actually like current settings.
Also never seen an increase of 1TB in 5 days.
2 Likes
Just spread the load…

2 Likes
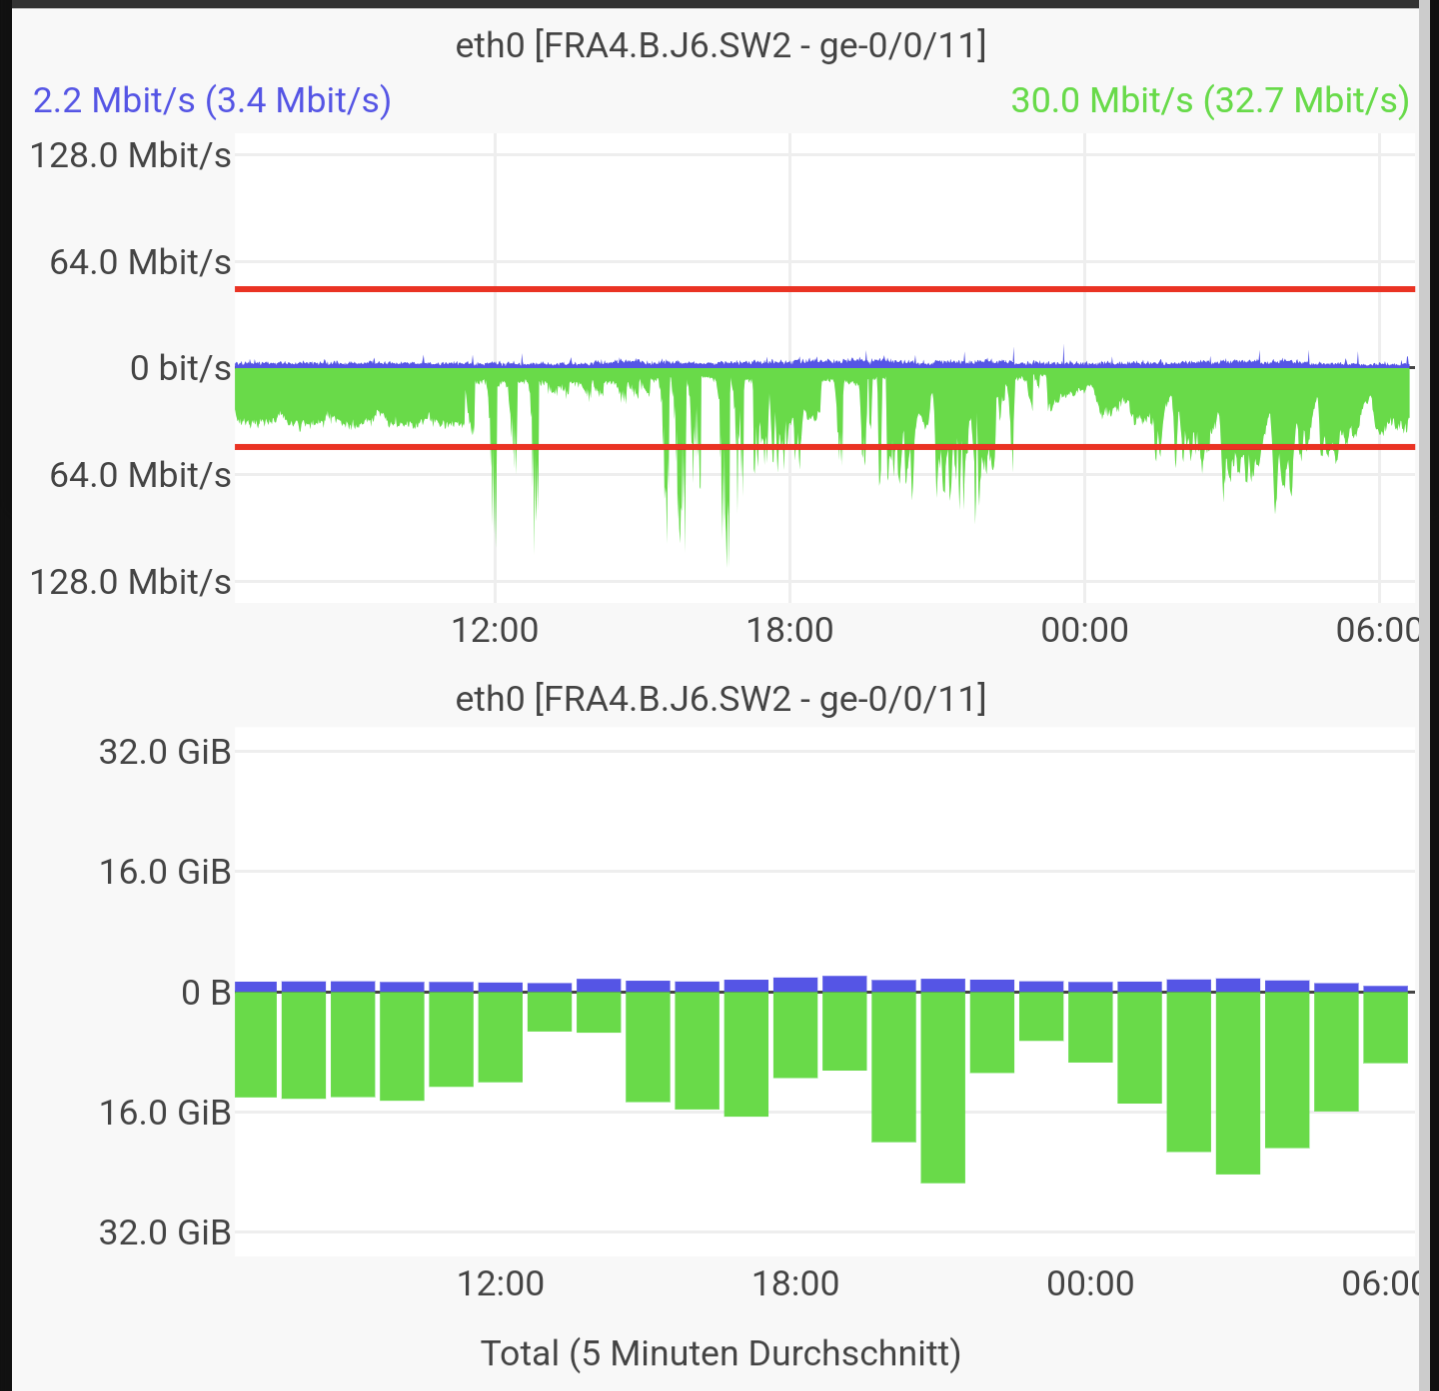
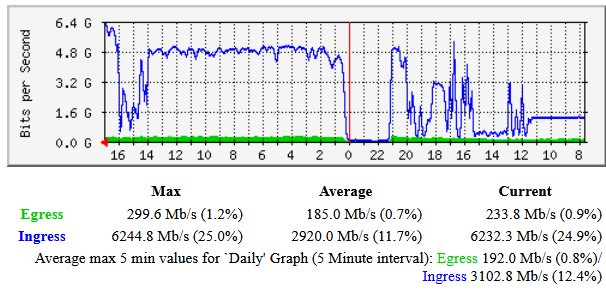
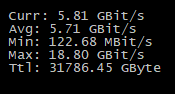
My aggregated bandwidth across all my nodes is now over 3gbit/s total since about midnight UTC+2. Never saw that before during your testing.
There is a large difference between my “good” nodes and my “not so good” nodes (scraped together from whatever was sitting on the shelf since 10+ years with varying performance)
Bandwidth is kind of not important. How much of it turns back to you in increased risk space?
I mean, of 1TB ingress only 650GB yesterday really turned back to me in disk space. Over the days it’s about 250GB per TB (also deduction of trash included).
You do realize that running this test impacts your customers?
My company noticed a significant performance drop, both when storing as well as retrieving data.
8 Likes
This depends on the initial size of the file. Perhaps it was not enough small to be stored as an inline segment.
You spotted it correctly. You are limited by their bandwidth. You may try to use a different VPN provider with a port forwarding, but I believe that it wouldn’t be free unfortunately.
It would be better to contact your ISP to get a public IP.
Perhaps depends on the used model of the disk?
I shared your feedback with the team. We didn’t expect, that it may affect customers, sorry about this!
Could you please file a support ticket to check, why is it happen?
I’m surprised a customer noticed the testing: it looked like the network had so much spare capacity they wouldn’t notice. But I guess the last 12h have really been pushing it!
I suppose that will also affect their TTL duration decision, for capacity-reservation? Like maybe 1-month TTL would mean they’d have to sustain too-high uploads and could affect paying customers… but a 3-month TTL would allow them to upload slow-and-steady and not be noticed?
2 Likes
This is interesting:
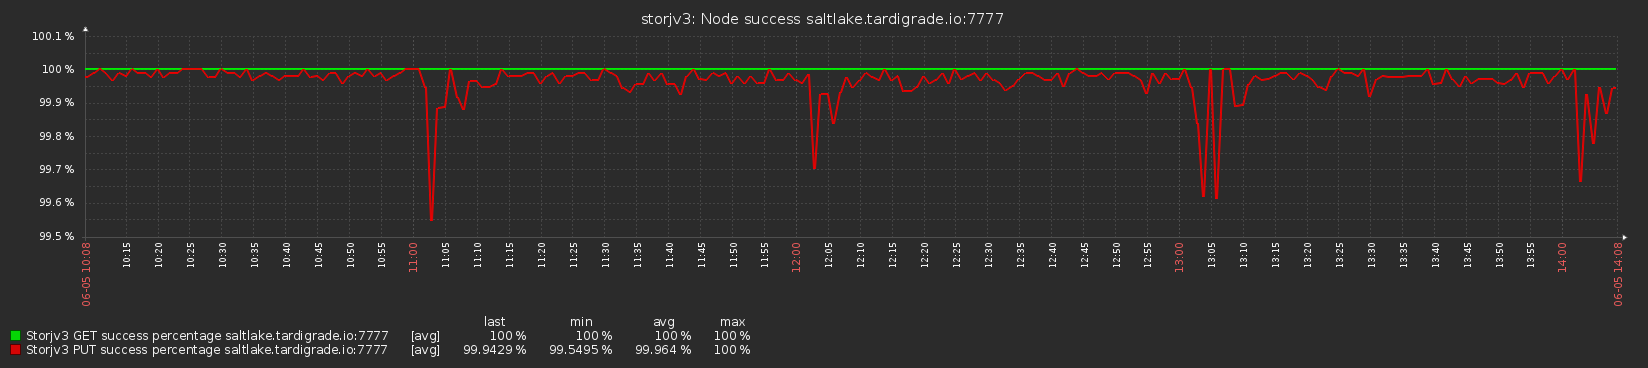
Some kind of process runs every hour (a type of filewalker probably, looks like the node is deleting a lot of expired pieces at the beginning of each hour), and as it runs, it increases the IO load, lowering success score for a bit. Then the satellite drops my node from the list for a few minutes until probably some kind of timeout expires.
The success rate does not seem to drop that much though.
They are testing performance, so they probably periodically load the network as much as possible.
1 Like
From a network guy’s perspective, even if storj keeps pumping test data, I do see a reason for it to affect performance. Disk heads need to be moved to write the test data, and they need to be moved to read customer data. All this while the node ACKs the incoming data, eating into its upload capacity (network overhead + processing).
2 Likes
The current success tracker is really good in dialing down the request rate the moment your node is failling a few uploads in a row. This happens so fast that you will have a hard time to measure the success rate on your side. It will still look like almost 100%. Best indicator now is the upload rate hitting your node.
3 Likes
And compare it to what?
Maybe just to your same node at any other point in time?
Like even if data sizes vary you can still count “upload started” vs. “uploaded” and “upload canceled” log entries to see rate of race wins/losses over 5min or something. I think what littleskunk is saying is that when your node gets slow ingress it may show 99/100 wins… and during performance testing it may see 990/1000 wins. Either way you’re winning 99%…
… and the reason you don’t see 990/10000 (9.9% win) is that the system backed off the ingress rate as soon as it saw you starting to lose a few more races… so it never ramped up from 1000 to 10000. It’s trying not to overwhelm nodes.
(at least that’s my guess ![]() )
)
Single node :
tail -f server002-v1.104.5-30002.log |grep --line-buffered "1wFTAgs9DP5RSnCqKV1eLf6N9wtk4EAtmN5DpSxcs8EjT69tGE" | grep --line-buffered 'upload started' | pv --line-mode --average-rate > /dev/null
[39,9 /s]

All nodes :
tail -f server* |grep --line-buffered "1wFTAgs9DP5RSnCqKV1eLf6N9wtk4EAtmN5DpSxcs8EjT69tGE" | grep --line-buffered 'upload started' | pv --line-mode --average-rate > /dev/null
[3,11k/s]
Th3Van.dk
2 Likes
I think @Toyoo’s point was that success rate used to be a decent measure to see if your node had issues. Now if there is little traffic, we don’t know if it’s just quiet on the network or our nodes are having issues.
1 Like