Никто Windows и не тестировал, естественно. И что она так неадекватно отреагирует на стандартный overcommit.
Ну теперь мы знаем, что надо по хорошему дать по 10 гиг свопа на ноду.
Тогда венда работает шоколадно со сторжом, иначе будет синька.
Спасибо Ваде, что маякнул за своп!
@Alexey now I wondering why I do not see any difference in memory usage memtbl active or not. 2 different servers One is with activ memtbl other is not active.
Nodes are almost same used size.
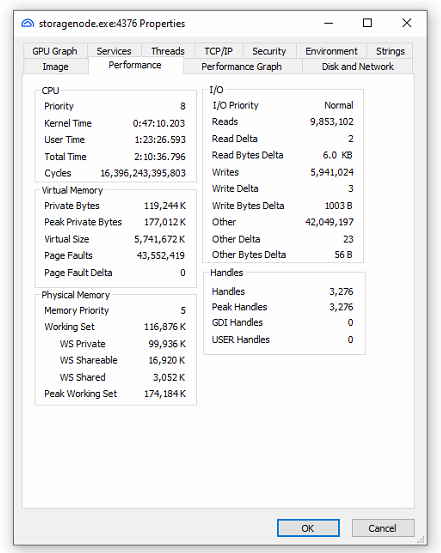
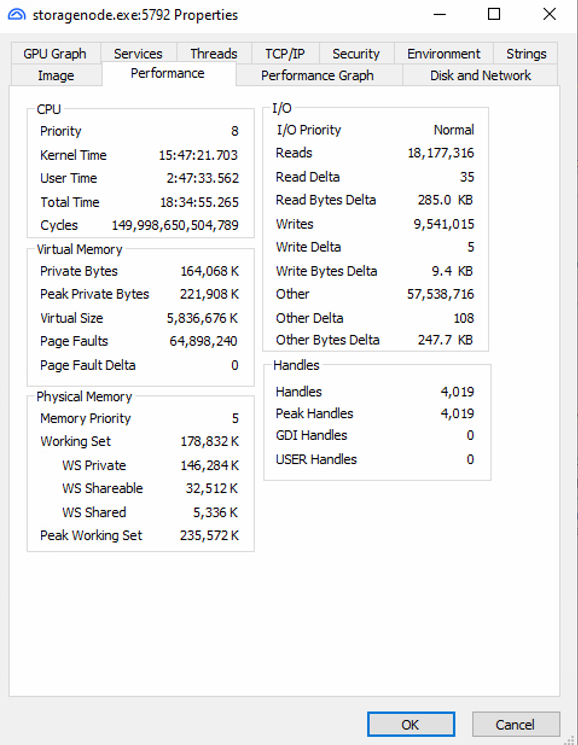
boath nodes are 95h+ online, so compaction should be done.
May be I done something wrong way, thats also possible.
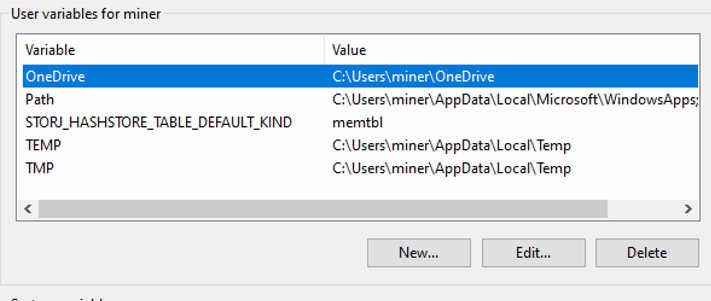
There is a big difference in memory usage between hashtbl and memtbl on linux. So I guess there is a bug in storj code for windows or some library they use.
There is a difference in physical memory usage: 120M (hashstore) vs 180M (memtbl), so it’s doing something.
Windows apparently just really doesn’t like the “virtual memory is 20x physical memory” thing. I’ve seen Linux systems with honenstly absurd amounts of reserved virtual memory, as long as it’s not actively used it usually works fine there.
My guess is that hashstore was mostly tested on Linux where the App “using” a few extra GB of address space isn’t a big deal because it’s just all overcommited anyway. That can (in theory) cause problems if all the apps suddenly decide to actually use all the memory they requested, but generally doesn’t.
Windows is a lot more strict about what it allows applications to request, so allocating several times more memory than ends up being used actually has consequences.
memtbl should consume up to 1.3GB ver TB used space, nodes are 2+TB used space so difernce shold be in GB of usage.
Looks like I added environmental variables for User instead of system variable.
So try new setup, need time for compaction start.
interesting do i need restart nodes than it start to work?
Of course. ENV variables are passed to the process on its start.
I believe that the next version will have them as options too.
Thank you now i see that node consume real RAM. but steel unclear why it eat so many virtual memory.
Likely because the virtual memory overcommit is handled properly on any other OS, but seems not on Windows.
Right now I do not have an answer.
I still wonder, what would happen, if you enable the automatic management of the swap file?
Best guess - it would most likely grow out of control?
Anyone up for the test? 
Worst case, the host will crash and you could go back to current manual settings. So no big harm I guess.
it not grow out, it reserv 4gb at the beginning, and then grow some on top of that.
and it all the time stay reserved.
can someone explain me why E5-2680 old cpu handle 16-18 nodes like a toy and
12700k have a depression on compaction with 100% with 16 nodes.
both has 96-128 GB ram, but on E5 it run on 2400mhz but on 12700k it 3200mhz
so it newer and should be more performant.
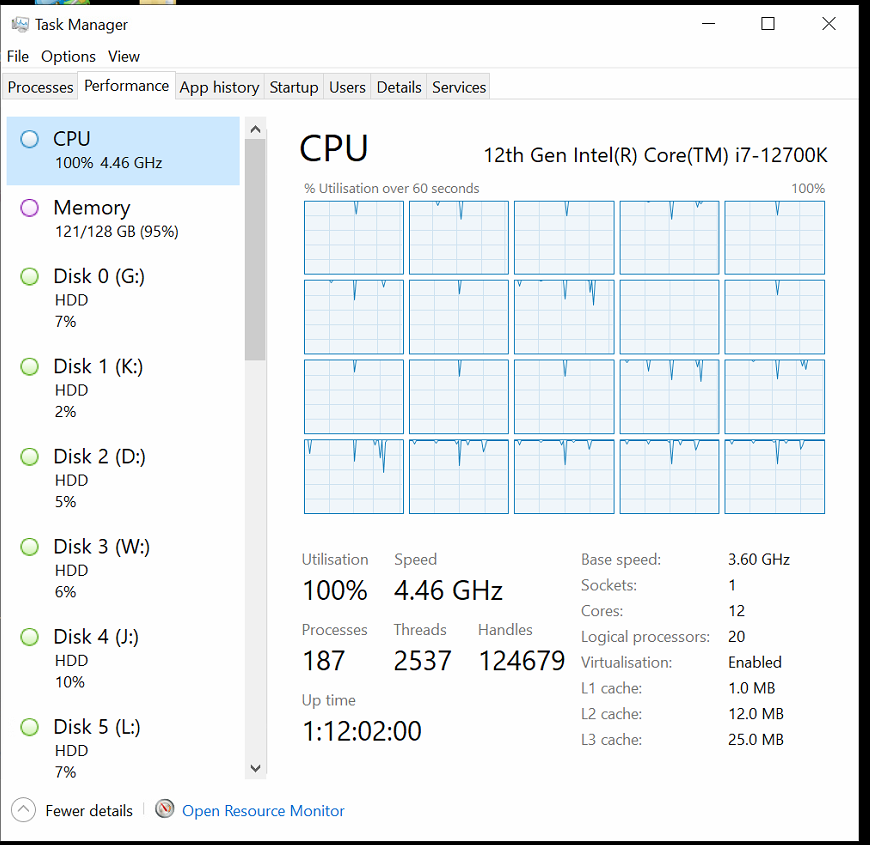
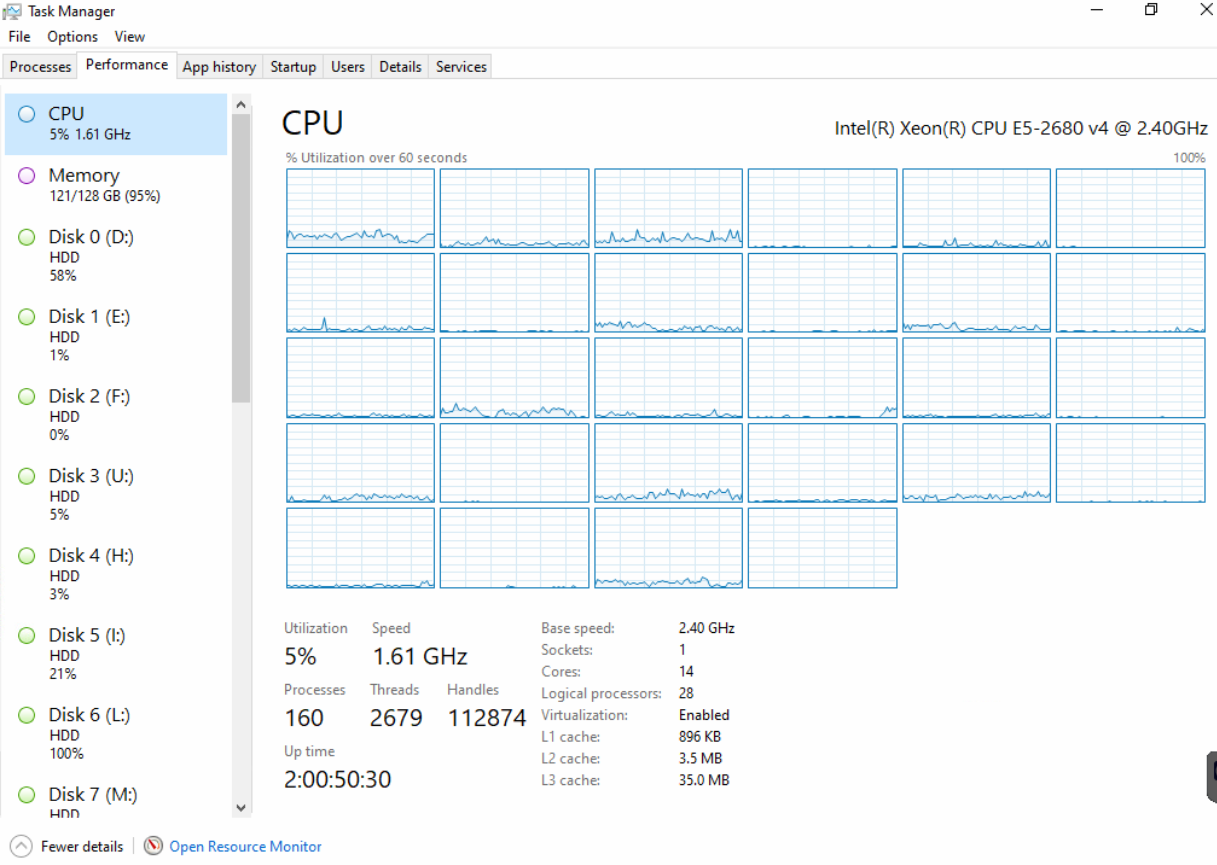
I have several of them, not one has any problem with cpu load
My best guess is the context switching and switch between P and E cores. I’ve seen this issue on windows many times - the scheduler is really bad at P/E priority and switching on these kinds of CPUs.
I would do either of these:
Disable E cores in BIOS (could be something like “disable Hybrid Techology”)
or… I’m not sure you’re gonna like this:
Switch to Linux (it handles hybrid CPU architechture much better) 
If you want to go more deep-dive into the issue, try either parking your E-cores or peg the processes to P-cores in windows. I don’t know by heart exactly how to do that on Windows, but I’m sure it possible with some PS magic.
thank you, i will search information about it.
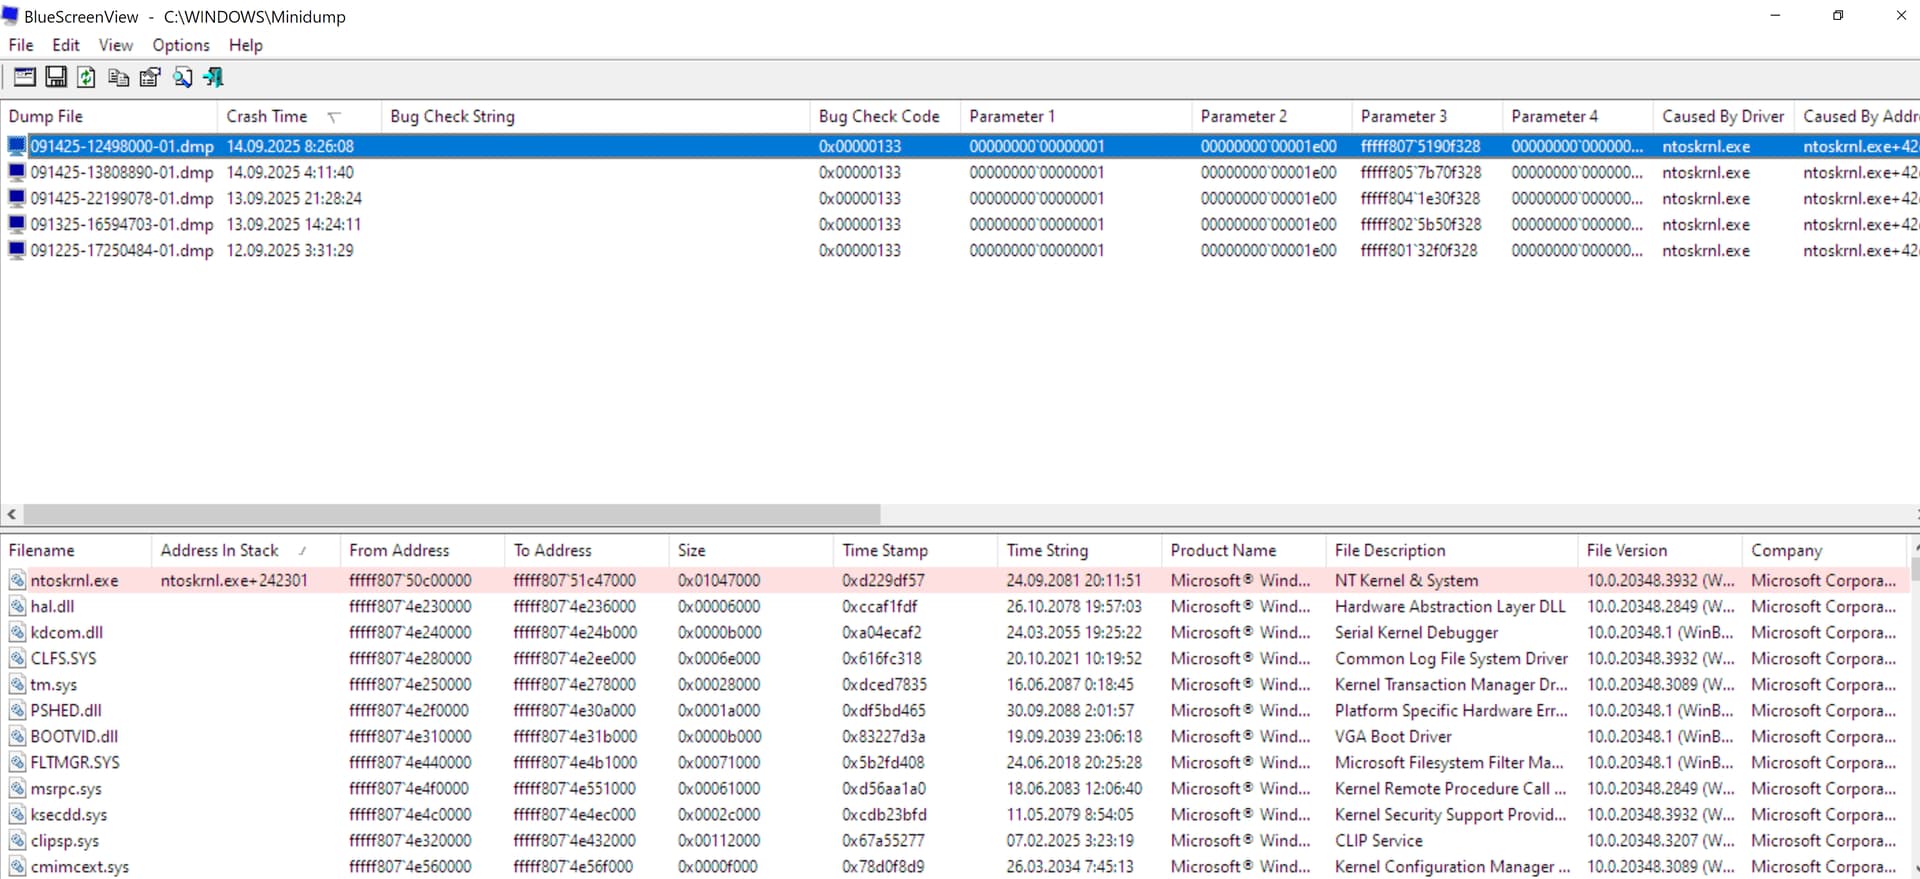
Алексей, в этом нет ни чего интересного - это будет синий экран смерти. Затем, спустя время, из за экрана смерти, будет дисквал мелких нод до 300гб хранения. Потому как повреждены будут файлы log, содержащие множество кусков - эффект мультипликатора. Так что хешстор при некорректном завершении работы ноды несет очень вероятный дисквал, особо мелких нод. Я потерял 14 нод от 100 до 300гб хранения , из-за 5 экранов смерти возникавших от нехватки свопа. 4тб свопа решили проблему. Правило хорошего тона выделять фиксированный своп по 10гб на ноду при использовании хешстора.
Спасибо за разъяснение. Передал команде, что установки по умолчанию не дают нормально работать hashstore под Windows при большом количестве узлов и требуют донастройки системы.
May be it will be better to find out what is this 4gb that it reserve but not use?
You can download heap profile from http://127.0.0.1:8729/debug/pprof/heap which shows the allocation. (Assuming you enabled debug port on 8729. (STORJ_DEBUG_ADDRESS=127.0.0.1:8729)
Than share the downloaded file here.
(It can be visualized locally with go tool pprof -web /tmp/heap.pprof)
I dont have go compilator, to use pprof tool
it will take litle time to install