Interesting, that woudl explain it. I don’t use warp – it sort of defeats the point for my useacase: being able to reach my service from anything internet connectd.
It is, but that’s what Cloudflare is for ![]()
Interesting, that woudl explain it. I don’t use warp – it sort of defeats the point for my useacase: being able to reach my service from anything internet connectd.
It is, but that’s what Cloudflare is for ![]()
Great stuff alltogether ![]()
I’ll keep an eye out for running compactions.
Here is the generated guide with copy/pastable commands on how to run it on linux and freebsd as a service:
You can define working directory for it in the service file.
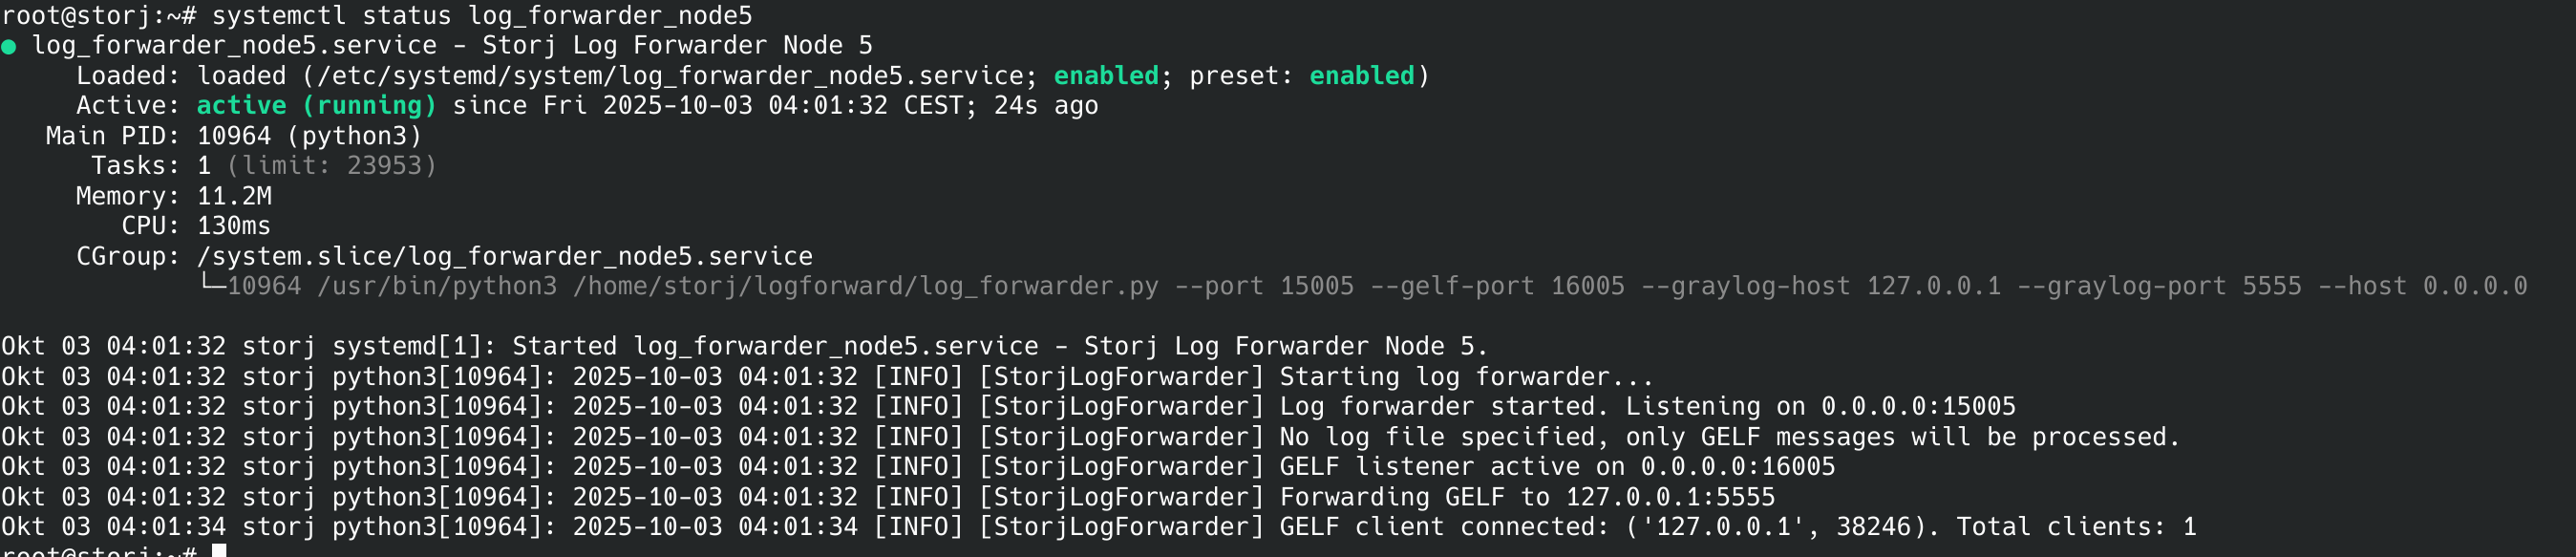
And similar one on starting log forwarder, if node runs on a different system:
Hello,
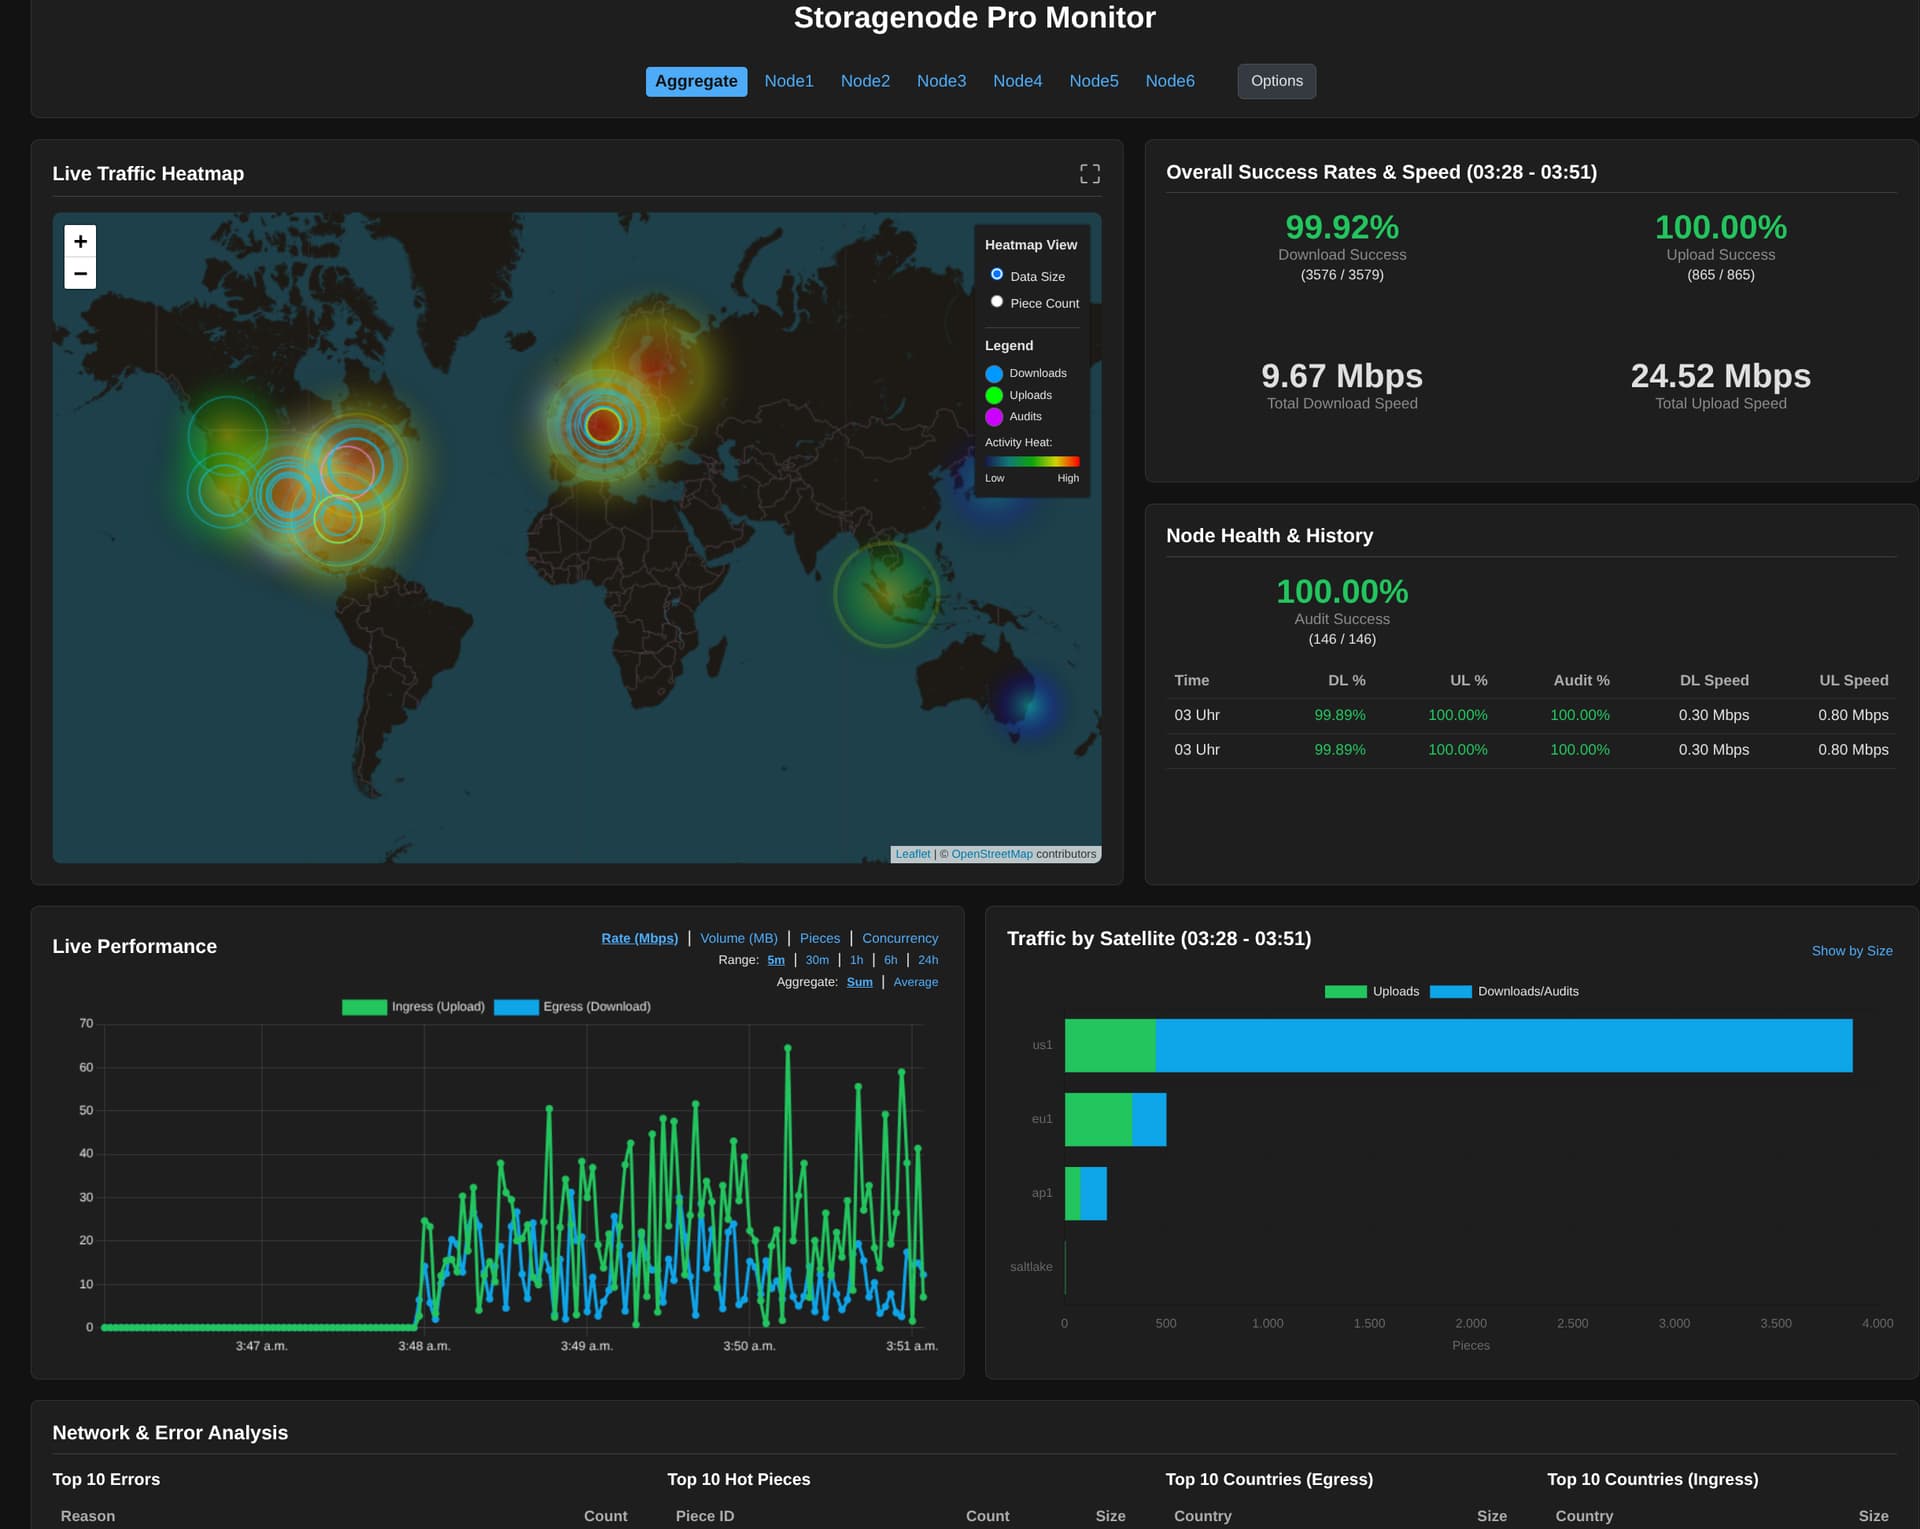
I got your Dashboard up and running and i like it!
I added a function to your forwarder script to acceppt gelf connections from docker. so i can use it for graylog and your dashboard at the same time. If you want, i can give you the new forwarder and you can take a look at it (or perhaps add this funktion to your repo). I even followed your style and let AI (ChatGPT and Copilot) do almost everything.
I will late add my remote nodes too and then put out the dashboard, so anyone can have a look to ![]()
Good night
I got everything up and Running, if you want too see my nodes work:
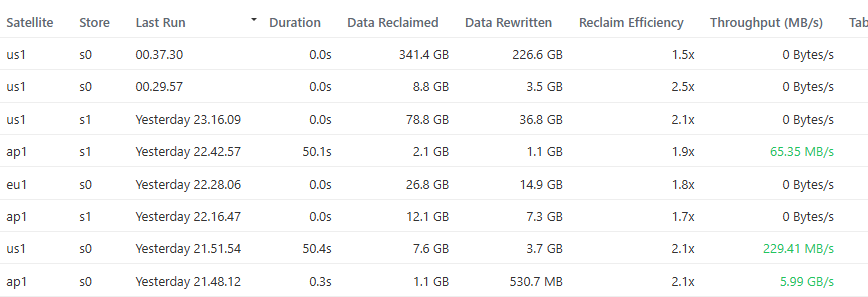
Two Question i have: What is meant with Table load on the Compaction Details?
And do you want the Code to also be able to revieve messages via docker gelf? Should i make a PR request for it? (But please dont merge it, because all log handler code is untested)
And you should add a little ad for yourself at the bottom ![]()
Ps: somehow I have the feeling that the compaction duration is not tracked right ![]()
Quite possible. I noticed it is sometimes zero, which can’t be correct.
What I also noticed, is that node log message returns bad data in the duration field, maybe this is the actual root cause — node monitor can’t make sense of it, so it’s zero.
We can of course ignore this field and calculate the duration by observing start and finish message arrival time.
I’ll feed the screenshot and the actual log to the bot and ask it to fix it.
I’ll ask that too ![]()
I would not do that: I don’t own the code, I did not write the code, I did not even review the code; and I have very little to do with it.
I was considering which license to attach to the code but still could not decide. Probably CC0 wools be the most appropriate, or the unlicense.
If i look, it seems that Aggregate isnt working right either. if i compare a single (or multiple) the stats are different:
All:
Only Local nodes:
only remote nodes;
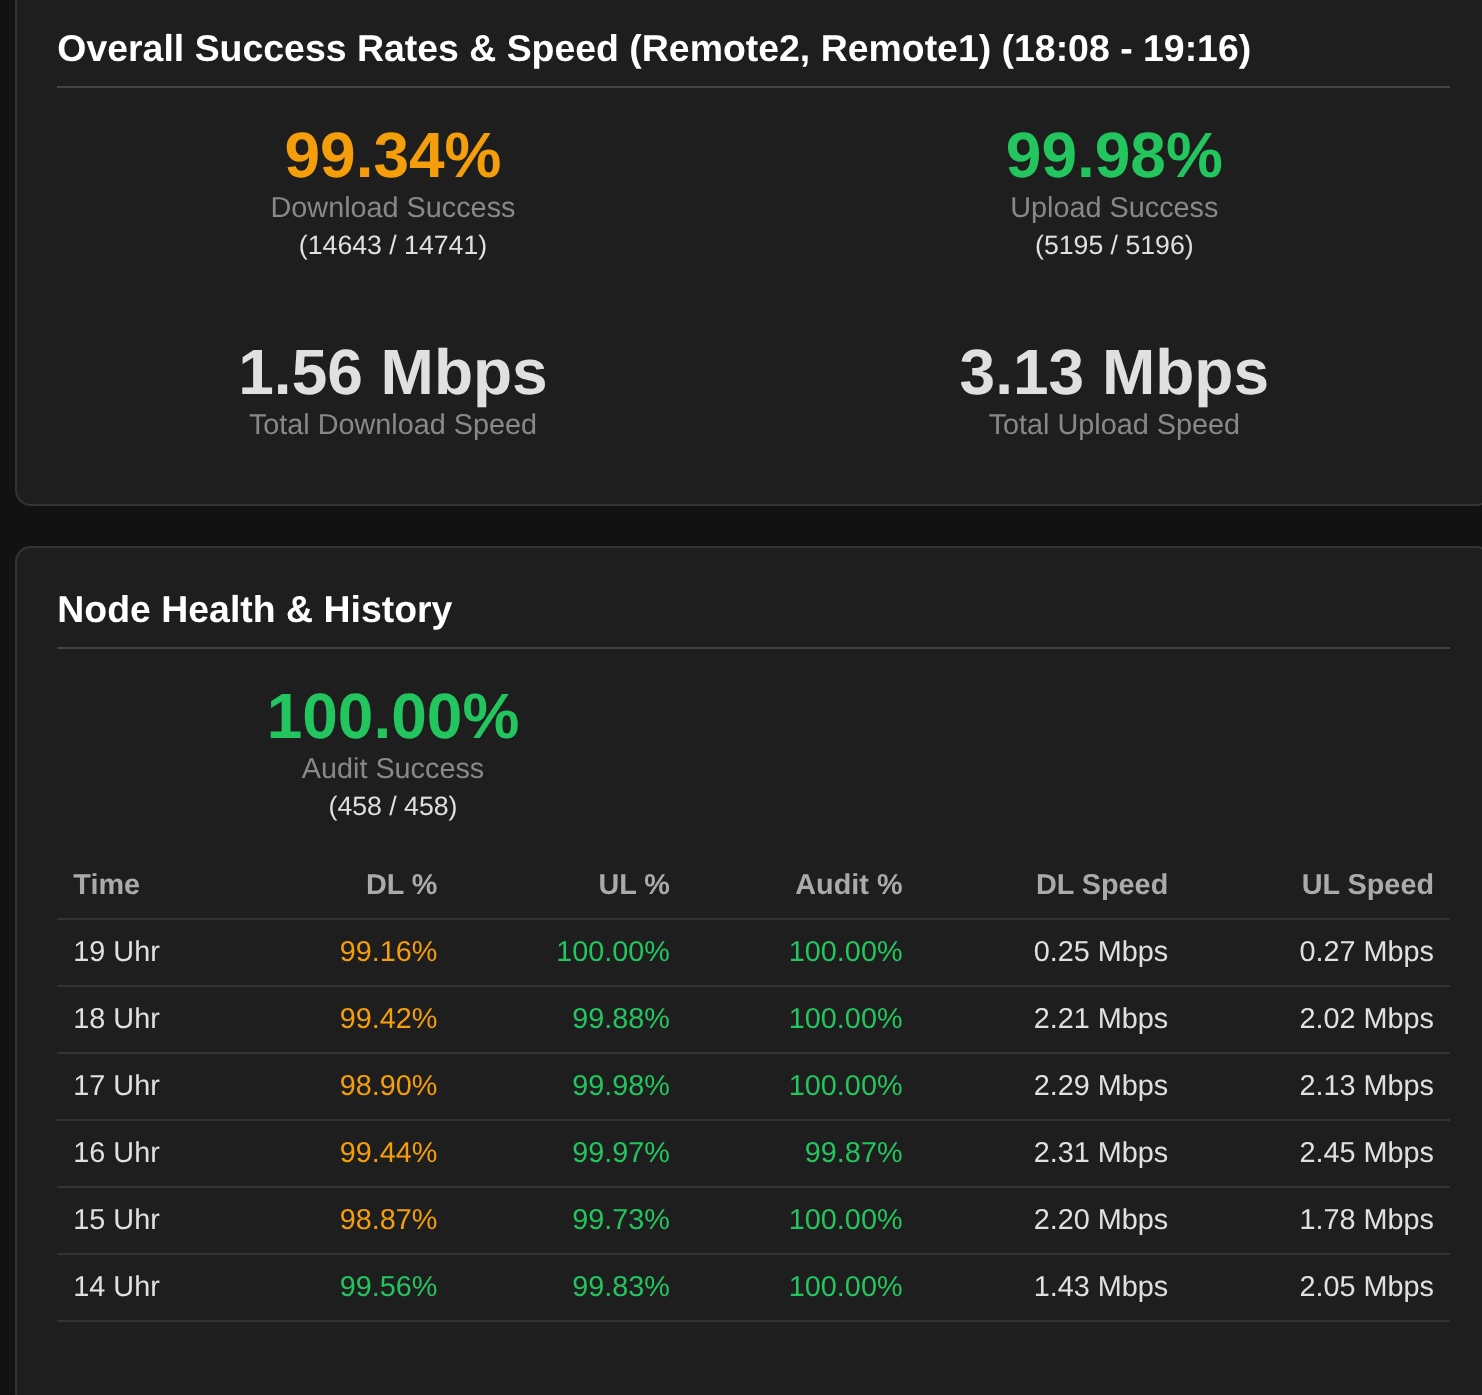
Ps: The times under Node Health and History are often dubbled ![]()
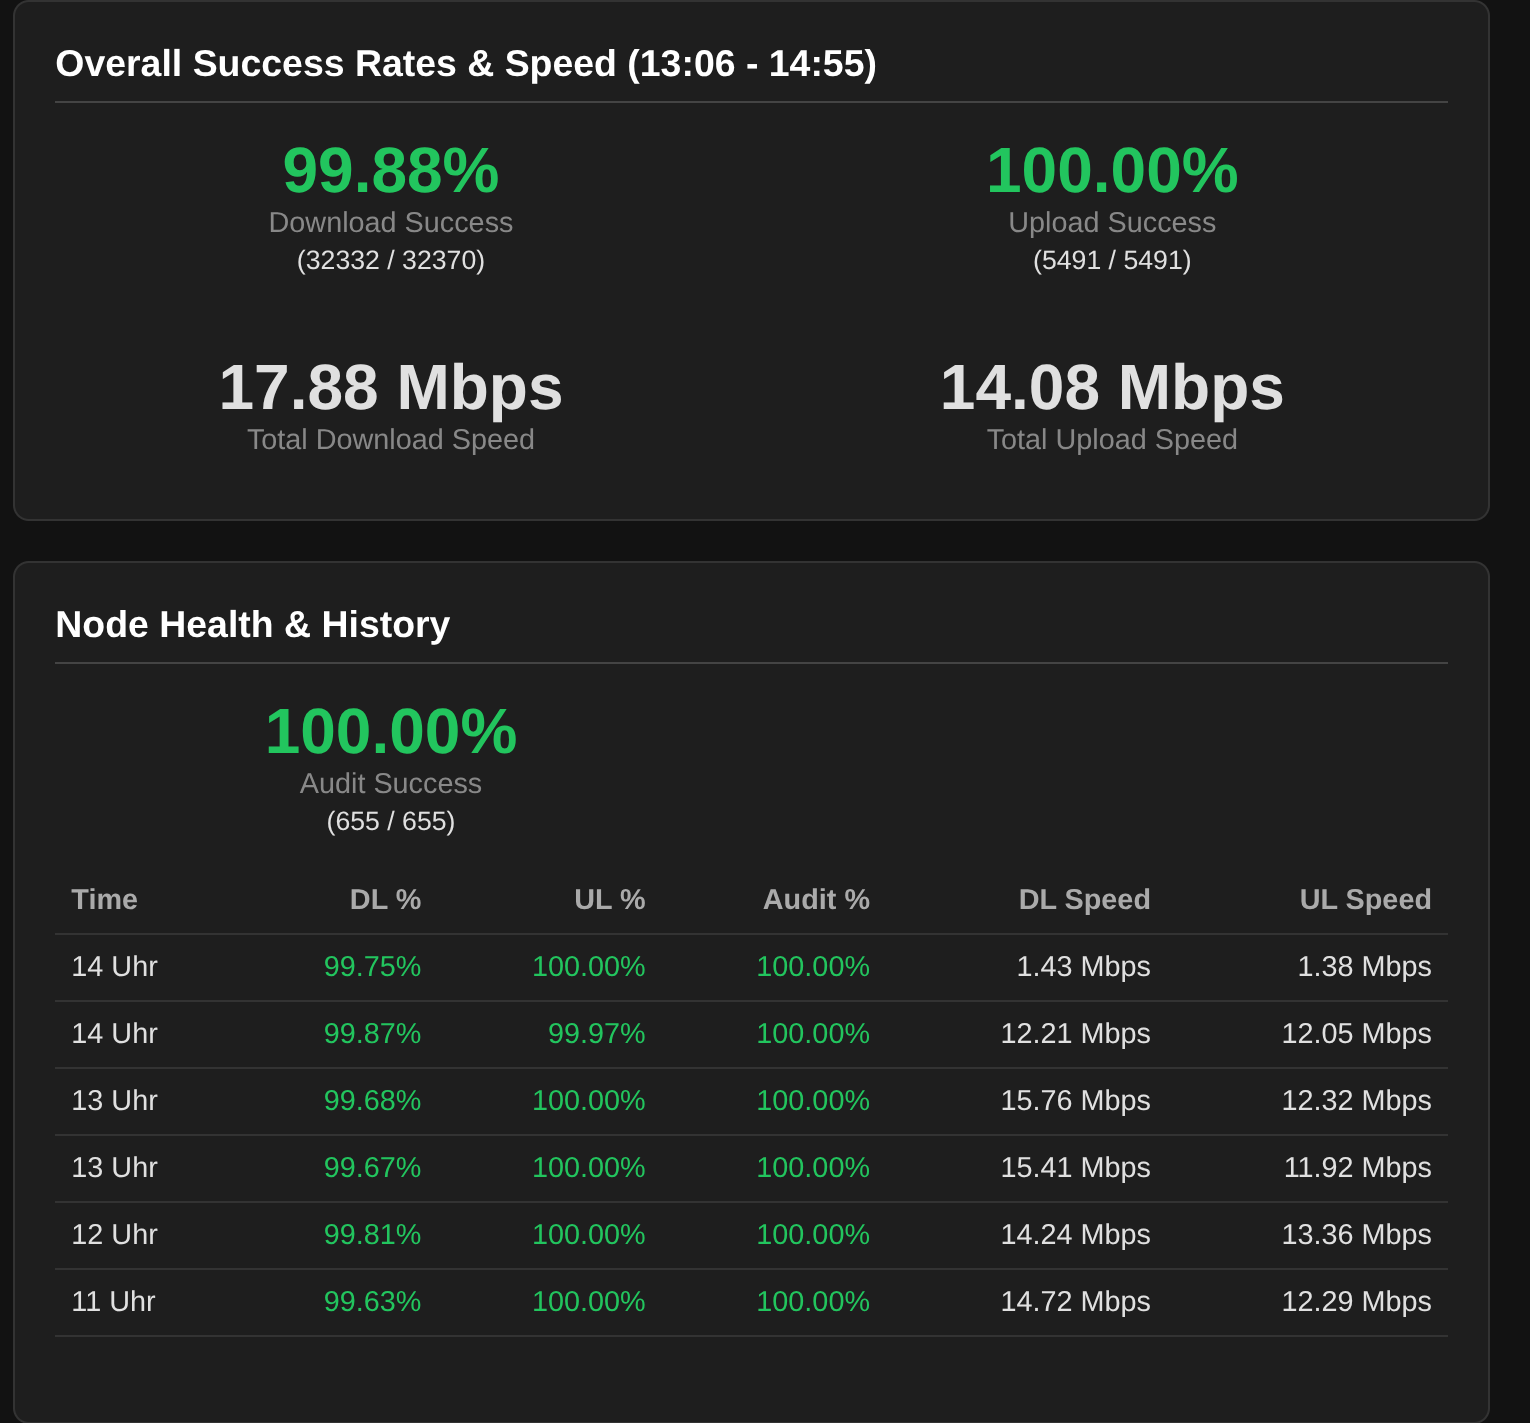
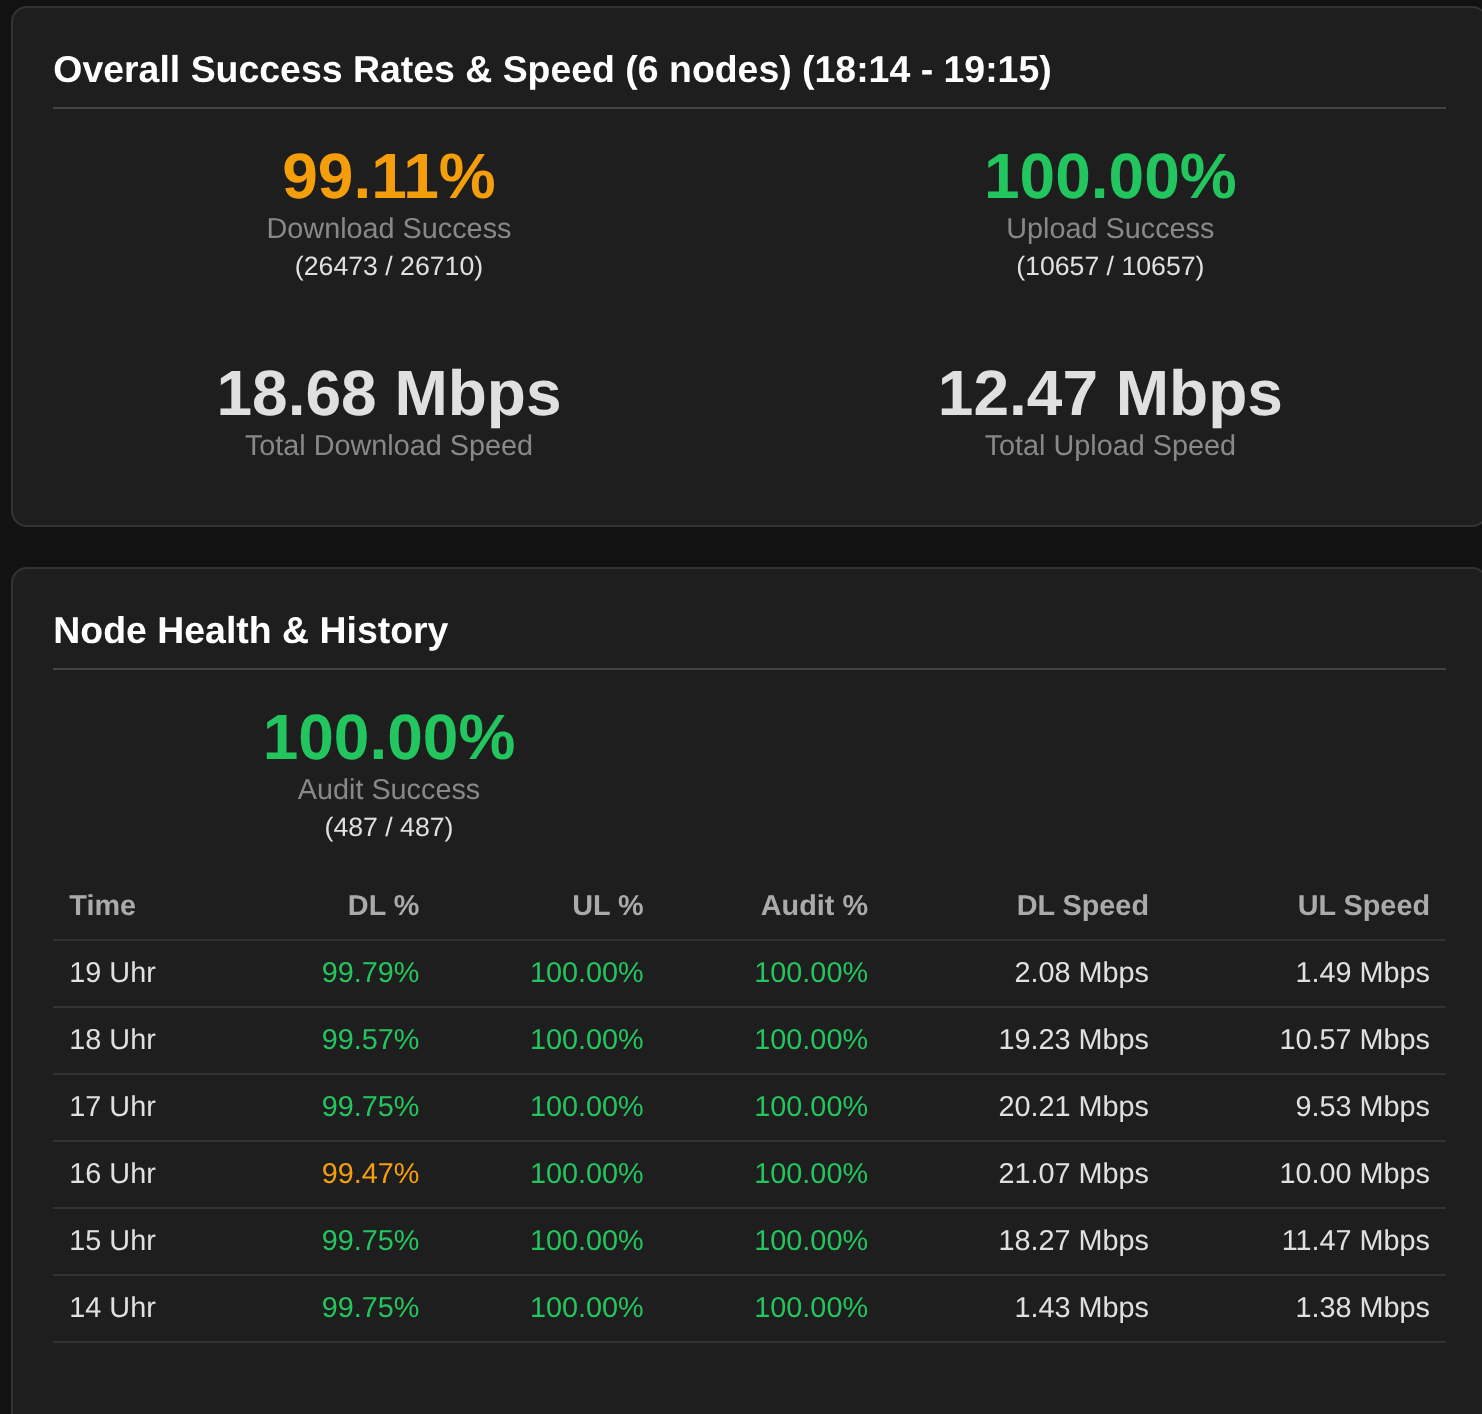
Your screenshots are from different times:
first screenshot shows data from 13:06-14:55, and two other screenshots – 18:14-19:15 and 18:08-19:16
Nope, all taken with the same dashboard open and just reselected the nodes.
I restarted it and it changed the time. But if i look at your dashboard, the behavior is the same
Ok, it seems there is a problem with getting data from two last nodes on my dashboard, but all data from the rest of nodes has consistent time ranges. Let me explore it more.
The on last two nodes log forwarder crashed, hence no data since 4AM
2025-10-02 04:02:53 [INFO] [StorjLogForwarder] Last client disconnected. Stopping file tailing.
2025-10-02 04:02:53 [INFO] [StorjLogForwarder] 'tail' task is being cancelled.
2025-10-02 04:02:53 [INFO] [StorjLogForwarder] Terminating 'tail' process.
2025-10-02 04:02:53 [INFO] [StorjLogForwarder] 'tail' process stopped.
2025-10-02 04:02:53 [INFO] [StorjLogForwarder] Cleaned up for ('10.0.17.209', 49154). Total clients: 0
2025-10-02 04:02:53 [ERROR] [asyncio] Unhandled exception in client_connected_cb
transport: <_SelectorSocketTransport closed fd=7>
Traceback (most recent call last):
  File "/usr/local/storj_monitor/log_forwarder.py", line 137, in handle_new_connection
    await reader.read(1)
  File "/usr/local/lib/python3.11/asyncio/streams.py", line 711, in read
    await self._wait_for_data('read')
  File "/usr/local/lib/python3.11/asyncio/streams.py", line 543, in _wait_for_data
    await self._waiter
  File "/usr/local/lib/python3.11/asyncio/selector_events.py", line 999, in _read_ready__data_received
    data = self._sock.recv(self.max_size)
           ^^^^^^^^^^^^^^^^^^^^^^^^^^^^^^
TimeoutError: [Errno 60] Operation timed out
Around 4AM we had network connectivity glitch. Log forwarder needs to be more robust to swallow TimeoutError exceptions.
So looks like we need to have AI confirm that reports belonging to different time ranges should be agregated respecting those ranges.
I also experience that the “Node Health & History” is not consistently updated with current hours, it tends to get stuck a few hours back now and then.
I mostly have 0 seconds for the past few days:
Yes, i can stil see activity on the map but the time is stuck. Also the stats are not updating anymore until i restart website.py.
Yeah, it sees the start of the compaction. The timer is right too. But then it finishes and sets the time to 0s but the timer went up to like 8min.
For me that doesnt look like malformed time. Just like a space missing. Your “1m0.518026162s” is i think just 1 minute and 0.518026162s seconds. (a very precise timing). Everything above 1 minute is just staight up 0seconds in your dashboard.
Huh! this does makes sense. But just like me, whatever code is trying to parse it probably dies on this. Why bother with units in the log message – just put stuff in seconds!
storj# grep -o  '"duration": "[^\"]*' /var/log/storj.log
storj# grep -o  '"duration": "[^\"]*\"' /var/log/storj.log
"duration": "1.711046ms"
"duration": "1.099754ms"
"duration": "10.707938ms"
"duration": "50.709558ms"
"duration": "50.92513ms"
"duration": "15.953732767s"
"duration": "42.281562955s"
"duration": "39.257224174s"
"duration": "1m37.535505102s"
"duration": "1m37.536688728s"
"duration": "1.048425324s"
"duration": "28.787883397s"
"duration": "2.937144666s"
"duration": "32.814312969s"
"duration": "32.814550828s"
"duration": "1.874143ms"
"duration": "9.827885ms"
"duration": "48.69246ms"
"duration": "48.966468ms"
"duration": "746.325255ms"
"duration": "3.812062364s"
"duration": "1.849679606s"
"duration": "6.44617907s"
"duration": "6.446407199s"
"duration": "470.47175ms"
"duration": "4.140150349s"
"duration": "1.747283134s"
"duration": "6.399191518s"
"duration": "445.699014ms"
"duration": "12.259124597s"
"duration": "1.669738105s"
"duration": "14.413727879s"
"duration": "20.813165112s"
I took @thelastspark’s recommendation above and had Gemini refactor the whole thing.
I’m not sure how to continue. Shall I continue with a monolithic file or switch to refactored code?
The refactored branch “modular” is pushed in there.
The difference in usage would be uv run websies.py will need to be replaced with uv tool install . following by running it with storj_monitor --node.... Updating the tool would involve git pull followed by uv tool install . --reinstall
Tolerable? It will probably save me a lot of time waiting for the model chewing through a massive file.
I’ll try it out next week (out this weekend)
![]()
The default printer implementation for a golang Duration type is exactly this. You would actually have to put in an explicit conversion to a number to get seconds. Which, for just a random log entry, is difficult to remember about and feels unnecessary.
Whom we are to complain about work you do for us? ![]()
As long as you provide clear instructions what to do for update and how to install and run as a deamon I suppose everyone will be fine. And currently your instructions are fantastic! So whatever suits you more.
Absolutely, I’ve just updated one of my servers, and it works will.
Didn’t make it into a background job yet, so still just running it in a “screen”, but it looks good and is working so far ![]()
Compaction being zero was quickly fixed by Gemini, but it introduced another bug where millisecond was confused with seconds. That one it got stuck on. It spent $4 trying various things and then I gave up. Asked anthropic sonnet (not even opus) and it immediately fixed this and neighboring subtle bug for $0.02.
That data made it into database so you would want to nuke it and ingest log files anew.
This is a recurring theme — Gemini is good at designing interfaces and web apps but it is lacking in critical and logical thinking and debugging. This makes them way too overpriced, in spite of being cheaper on paper. I observe the same using their own respective coding tools as with roocode (which is optimized better for antropic models if I remember correctly)
There was a subtle bug in aggregation display from multiple nodes when some of the nodes were offline for a while — the cached value was used instead of zeroes when aggregating. This also was quickly and cheaply fixed by recent sonnet. I literary copy/pasted your messages and screenshots and it figured it out. At least the issue I was also seeing is now gone.
That’s not me. That’s Gemini. It’s good at that. I don’t contribute on purpose, outside of demanding things.