stop making the rest of us look stupid… xD
thats really clever even if not super easy to read, but sure does relay most of the required data
and thanks
stop making the rest of us look stupid… xD
thats really clever even if not super easy to read, but sure does relay most of the required data
and thanks
I am used to this type of traffic graph and prefer it instead of GB/day, GB/month or something like that.
I like the graph, and it is just my opinion or preference, (you might not need this info in such a detail as me)
I am wondering (maybe i am not used to read it clearly from chart)
Do you have on the chart information on how much data per TB stored is your node sending?
Because for me it is quite important information if the node is enough profitable - but you might not be interested in this, maybe you just want to participate ![]() in the project.
in the project.
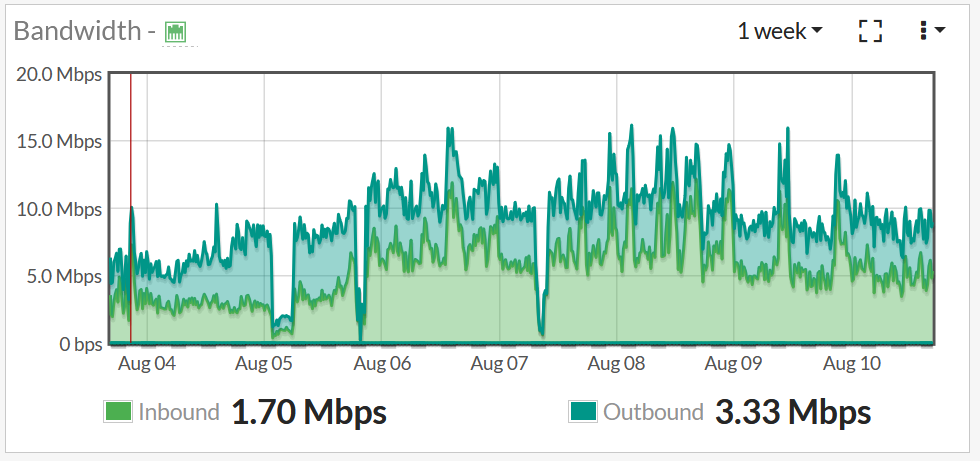
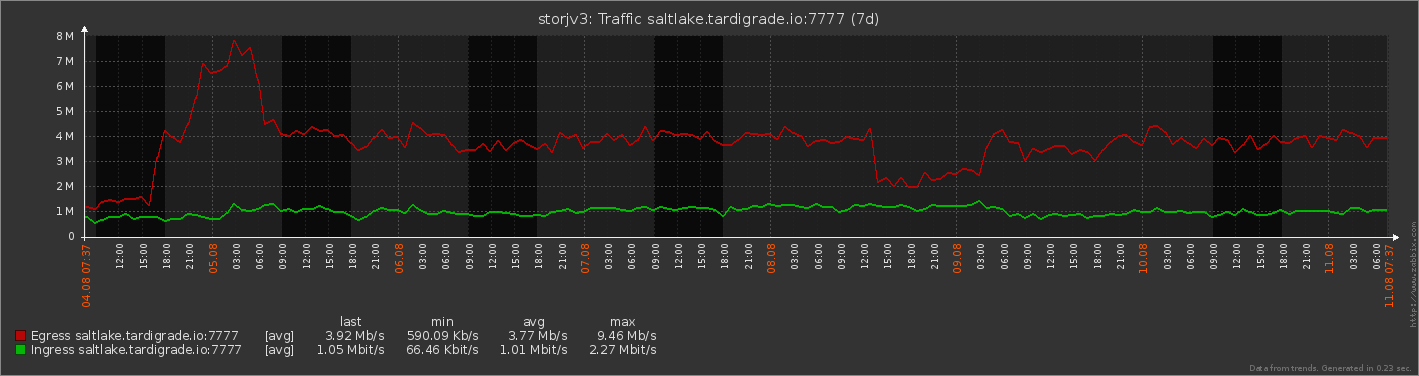
Also I am noticing that your node had much lower ingress than egress in last 2 weeks - so I am wondering if this chart (router?) is picking something more from your network ? - My egress is much lower than ingress (like 10:1) - that’s why I am asking…
8Mbits would be quite nice egress for my taste, and it might be misleading if you need one day to troubleshoot any problems…
But again it’s just my take on that, nothing more.
And I think I remember you were saying that there is other traffic on that chart.
Anyway some rambling of old man… moving on… ![]()
My node currently has 15.4TB stored and I do not have a graph of mbps/TB, though I guess I could create one as I have the data. Profitability for me is not mbps/TB, but mbps (or TB/month) total, but I do not think my node would be profitable enough to be “worth it” unless storj gets a lot of customers, so I’m just waiting. Maybe I’ll get bored in the future.
This graph is for the node VM - the only additional traffic here would be ssh for CLI dashboard and monitoring traffic, but that should only amount to a few kbps. Also:
                   Available        Used     Egress      Ingress
     Bandwidth           N/A      1.1 TB     0.8 TB     365.9 GB (since Aug 1)
          Disk        1.1 TB     15.4 TB
It seems to match what the dashboard says.
I’ll try and throw together a script that shows space used by getting data from the logs (using the “Available space” it gives every time an upload it started).
As a bonus it will also help me improve my coding skills ! I’ll write it in C so that it can be compiled for windows and Linux (also because I’m not too familiar with python).
yeah for me thus far it’s mainly just been a sinkhole for money that i could spare…
barely pays the electricity at the moment…and if i factor in all the extra things that are running because of the server… then i doubt it’s even paying for electricity…
but yeah i see potential in the future of the project… and don’t mind running with a loss while i get everything dialed in…
You see, your egress is GIGANTIC! in those terms - meaning even with major rounding
0.8 TB of egress for ~10 days ! that’s like 80GB / Day on average.
That gives unfortunately only 61 kb/s / TB stored… it’s I would say NICE-ish on average!
That gives you pretty nice efficiency - one of the highest here.
It even means that your node is quite profitable - (depending on your hardware specs of course) what is not the case to deep dive right now.
Just the 61 kb/s / TB is one of the highest here. (I think only thej has one of his nodes with higher egress per TB stored)
That amount is what I would call super if I had that numbers given my current specs.
That means that depending on your setup - if you bought each TB for ~$30 it is quite profitable (not taking into account power consumption or other hardware)
I guess I got lucky this time and my node is storing the test data that is accessed more frequently.
i’m at 615 GB and i’m behind in capacity by a couple of tb… so maybe 20% and if it was an even 200gb difference then pentiums ingress would be 4/3 vs mine… so a 33% increase with maybe 20% less stored data… so seems pretty even really… without doing much deeper than a quick glance at the numbers.
i really have come to understand why egyptains was so fond of fractions, they are amazing for doing simple math.
10.08.2020:
| Node # | location | ISP | size | filled | full | vetted | EGRESS | EGRESS REPAIR | INGRESS | INGRESS REPAIR |
|---|---|---|---|---|---|---|---|---|---|---|
| Node 1 | 1 | 1 | 2.9TB | 2.9TB | y | y | 13,43GB | 13,81GB | 857MB | 373MB |
| Node 2 | 1 | 1 | 5.5TB | 1.24TB | n | y | 5,45GB | 4,63GB | 25,88GB | 11,52GB |
| Node 3 | 1 | 2 | 2.9TB | 2.9TB | y | y | 12,44GB | 1,56GB | 157MB | 95MB |
| Node 4 | 1 | 2 | 1.9TB | 1.9TB | y | y | 7,57GB | 505MB | 190MB | 70MB |
| Node 5 | 1 | 2 | 11TB | 1.1TB | n | y | 4,49GB | 187MB | 25,23GB | 11,65GB |
| Node 6 | 1 | 1 | 7.5TB | 73GB | n | n | 224MB | 0B | 1.63GB | 3.64GB |
| Node 7 | 1 | 2 | 8TB | 77GB | n | n | 243MB | 0B | 1.56GB | 3.81GB |
| Node 8 | 1 | 2 | 0.9TB | 46GB | n | n | 147MB | 0B | 1.55GB | 3.68GB |
| Node 9 | 1 | 1 | 0.9TB | 25GB | n | n | 86MB | 0B | 1.46GB | 3.29GB |
| Node 10 | 2 | 3 | 3.8TB | 3,8TB | y | y | 12.15GB | 15.19GB | 127MB | 60MB |
| Node 11 | 2 | 3 | 5.5TB | 3.82TB | n | y | 14.57GB | 1,03GB | 23.64GB | 13.4GB |
| Node 12 | 2 | 3 | 0.9TB | 80GB | n | n | 237MB | 0B | 2,69GB | 5.79GB |
that’s zabbix making those graphs right?
i think i finally had it with netdata… it just went belly up… for … 7th time in 5 months… sure maybe i’m not always nice to it… totally wasn’t my fault this time…
that’s interesting tho… i don’t seem to have that ingress…
could you post a dashboard info screenshot for yesterday and today ( when the day is done ofc ![]()
hmmm i am a bit behind in ingress… apperently restarting the node…once… not the server!
seems to have cost me 5gb ingress which is kinda odd because i think i was only gone for like 30sec maybe a minute.
or was this because i ran a scrub… hmmm well there is a slight deviation will need to dig a bit to see where that came from…
thanks ill look into installing zabbix then, been kinda avoiding it for a while… but netdata is just so bad… sadly, not because the overview or stats are bad… but because the programming seems unstable and bad…
i’m 8.59GB behind you in egress … so maybe 10%
I think I’m seeing pretty similar traffic to @Pentium100. It’s probably just a function of node age, since both our nodes have been around since the last wipe.

It’s 852GB egress total. Over 10.5 days. So a little over 81GB per day.
with 15.6TB stored total: 60.2kb/s / TB
What’s interesting is that about 3 months ago I added two new nodes. So I can compare performance of older vs newer nodes.
Oldest node: 66.0kb/s / TB
Newest node: 38.1kb/s / TB
Almost as new node: 40.9kb/s / TB
So yeah, it seems older data is downloaded a bit more often right now.
yeah egress is rather chaotic tho…
there seems to be trends to it, but very chaotic… ![]()
did you catch the time kevink had like 3-4 x egress for like a week or 10 days or so…
was weird…but who knows… tho i did find it interesting at the time that he had recently run GE or something like that on a couple of nodes…
He did? oh! didn’t see that. interesting why. Can you post a link to his posts (if it is easy for you)?
Maybe it was the cause of increased egress?
i think we talked about it in this thread… actually i’m pretty sure about that… maybe 14 days ago now… you might be able to simply scroll through it and load it into the browser and the do a search from the browser for keywords
it’s on the summery here… 9th of july was when it happened and it seems it was just twice the amount…
stil a big deviation… will do a new summery on of the coming days… covering an entire month…
Ahhh jeah he had bigger egress than any of us, just didn’t catch it was caused by GE
Thanx for the link to conversation!