I think you’re looking for this.
Edit:
Thanks for the correction, but I’m not SGC ![]()
I think you’re looking for this.
Edit:
Thanks for the correction, but I’m not SGC ![]()
sowwy… can’t find my glasses today LOL ![]()
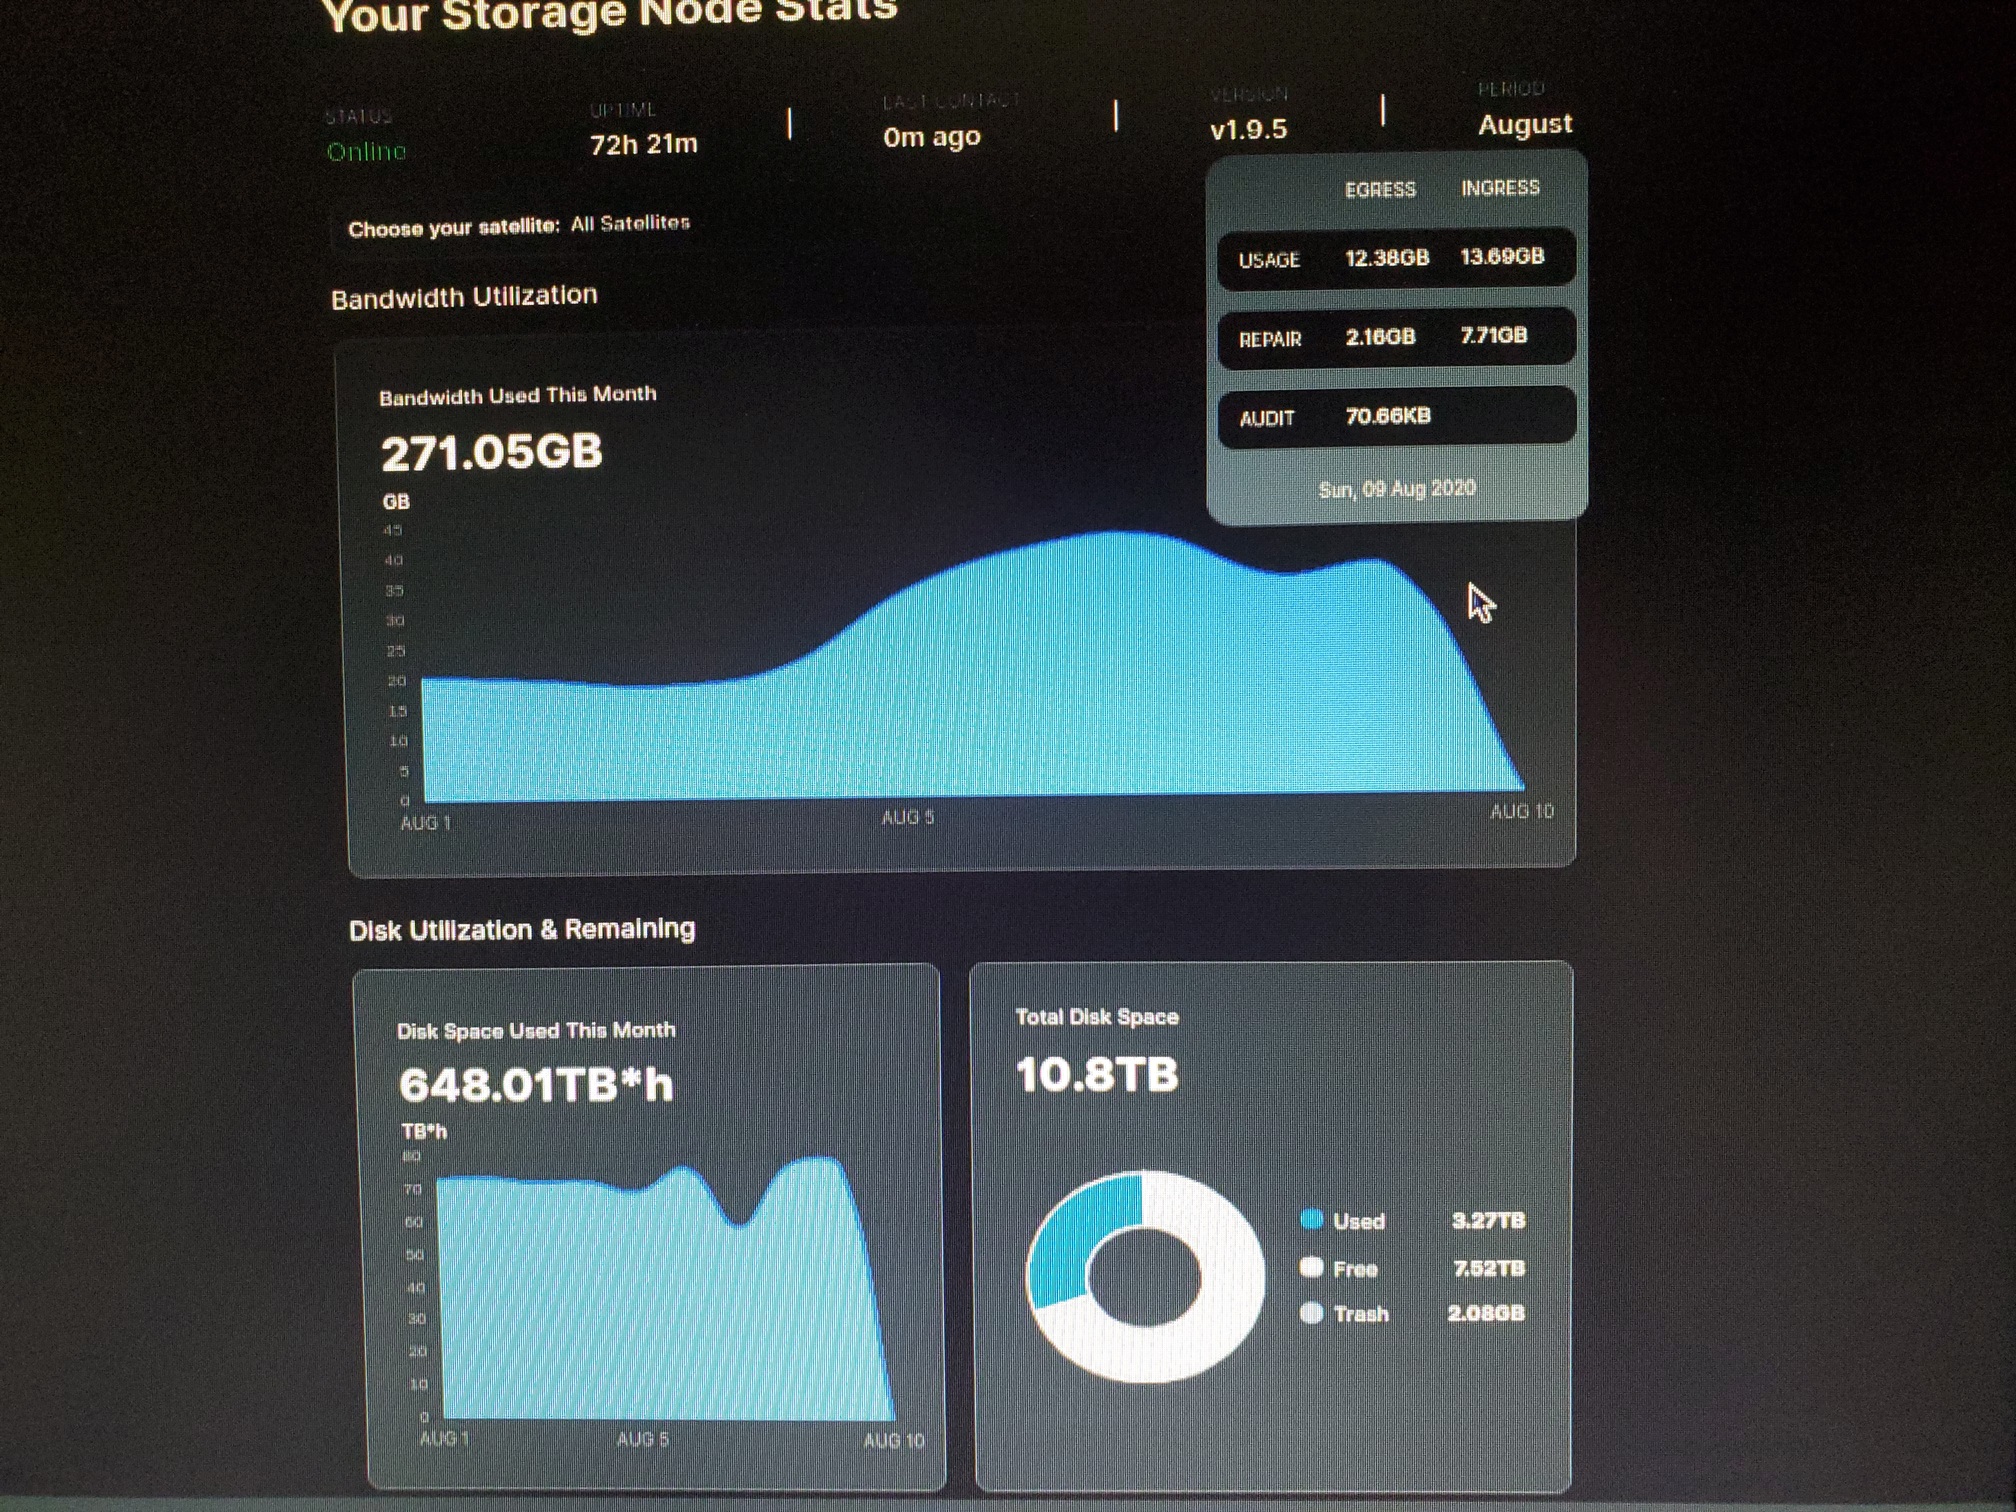
i think you might be referring to this… if not then please specify what exactly you are talking about… the SNOboard?
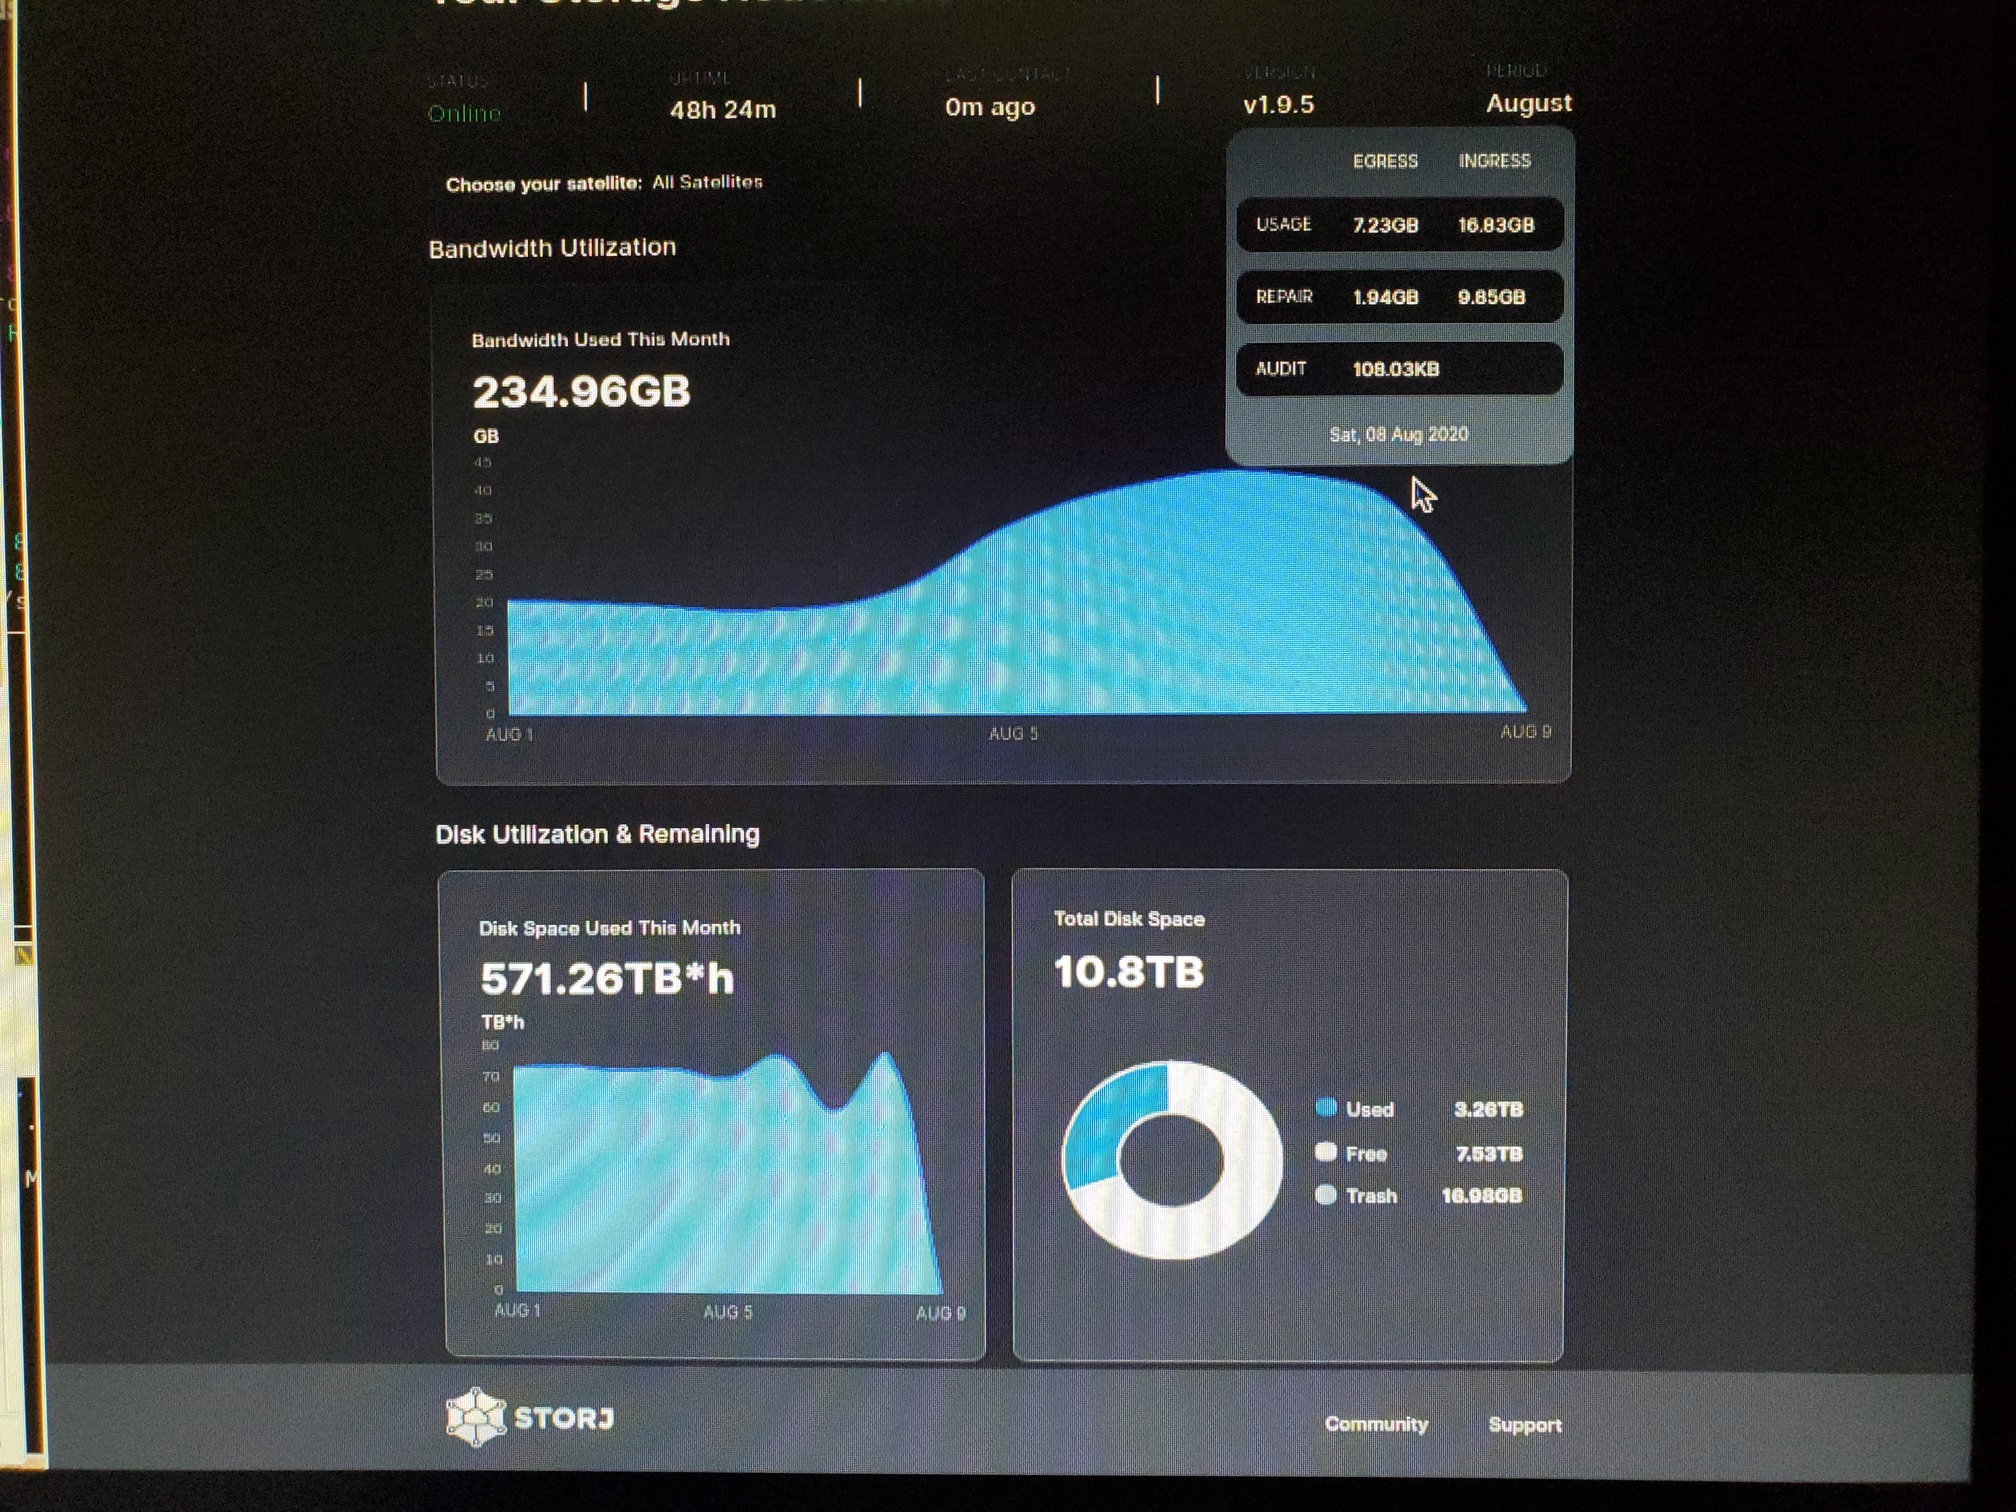
08.08.2020:
E…EGRESS; ER…. EGRESS REPAIR; I….INGRESS; IR….INGRESS REPAIR
Node 1 (3TB, full): E: 9,74GB ER: 16,13GB I: 0B IR: 0B
Node 2 (6TB, not full): E: 3,5GB ER: 5,7GB I: 34,36GB IR: 10,71GB
Node 3 (3TB, full): E: 7,4GB ER: 1,03GB I: 70MB IR: 11MB
Node 4 (2TB, full): E: 4,36GB ER: 231MB I:30MB IR: 8MB
Node 5 (12TB, not full): E: 2,56GB ER: 44MB I: 34,08GB IR: 10,69GB
Node 6 (8TB, not full, not vetted): E: 105MB ER: 0B I: 1,88GB IR: 4,69GB
Node 7 (8TB, not full, not vetted): E: 90MB ER: 0B I:2,1GB IR: 4,6GB
Node 8 (1TB, not full, not vetted): E:60MB ER: 0B I:1,78GB IR: 4,66GB
Node 9 (1TB, not full, not vetted): E:47MB ER: 0B I: 1,93 GB IR: 4,69GB
Node 10 (4TB, full): E: 6,05GB ER: 16,62GB I: 15MB IR: 7MB
Node 11 (6TB, not full): E: 9,54GB ER: 445MB I:33,1GB IR: 12,94GB
Node 12 (1TB, not full, not vetted): E:128MB ER: 0B I: 3,7GB IR: 7,15GB
@thej,
Did some calcs on your Nodes - at least for those “full” (for other nodes impossible - not enough data)
Node 1 - ~99.8 kb/s / TB stored - that’s what I would like to see on all my nodes - this kind of utilization if it is average - this node is quite efficient in utilization
but comparing to node 3
Node 3 - has like 32 kb/s /TB stored - not too much cash from it
What is the difference between those two nodes? age? hardware? anything else?
Also do you have more detailed info about nodes that are not full? - because you cannot do those calculations on “not full” info - the kb/s /TB stored needs a number on used space.
Also - if you like to do something like this table below:
| value1 | value2 |
|---|---|
| a | b |
| You can export your data in this format: | |
|  |
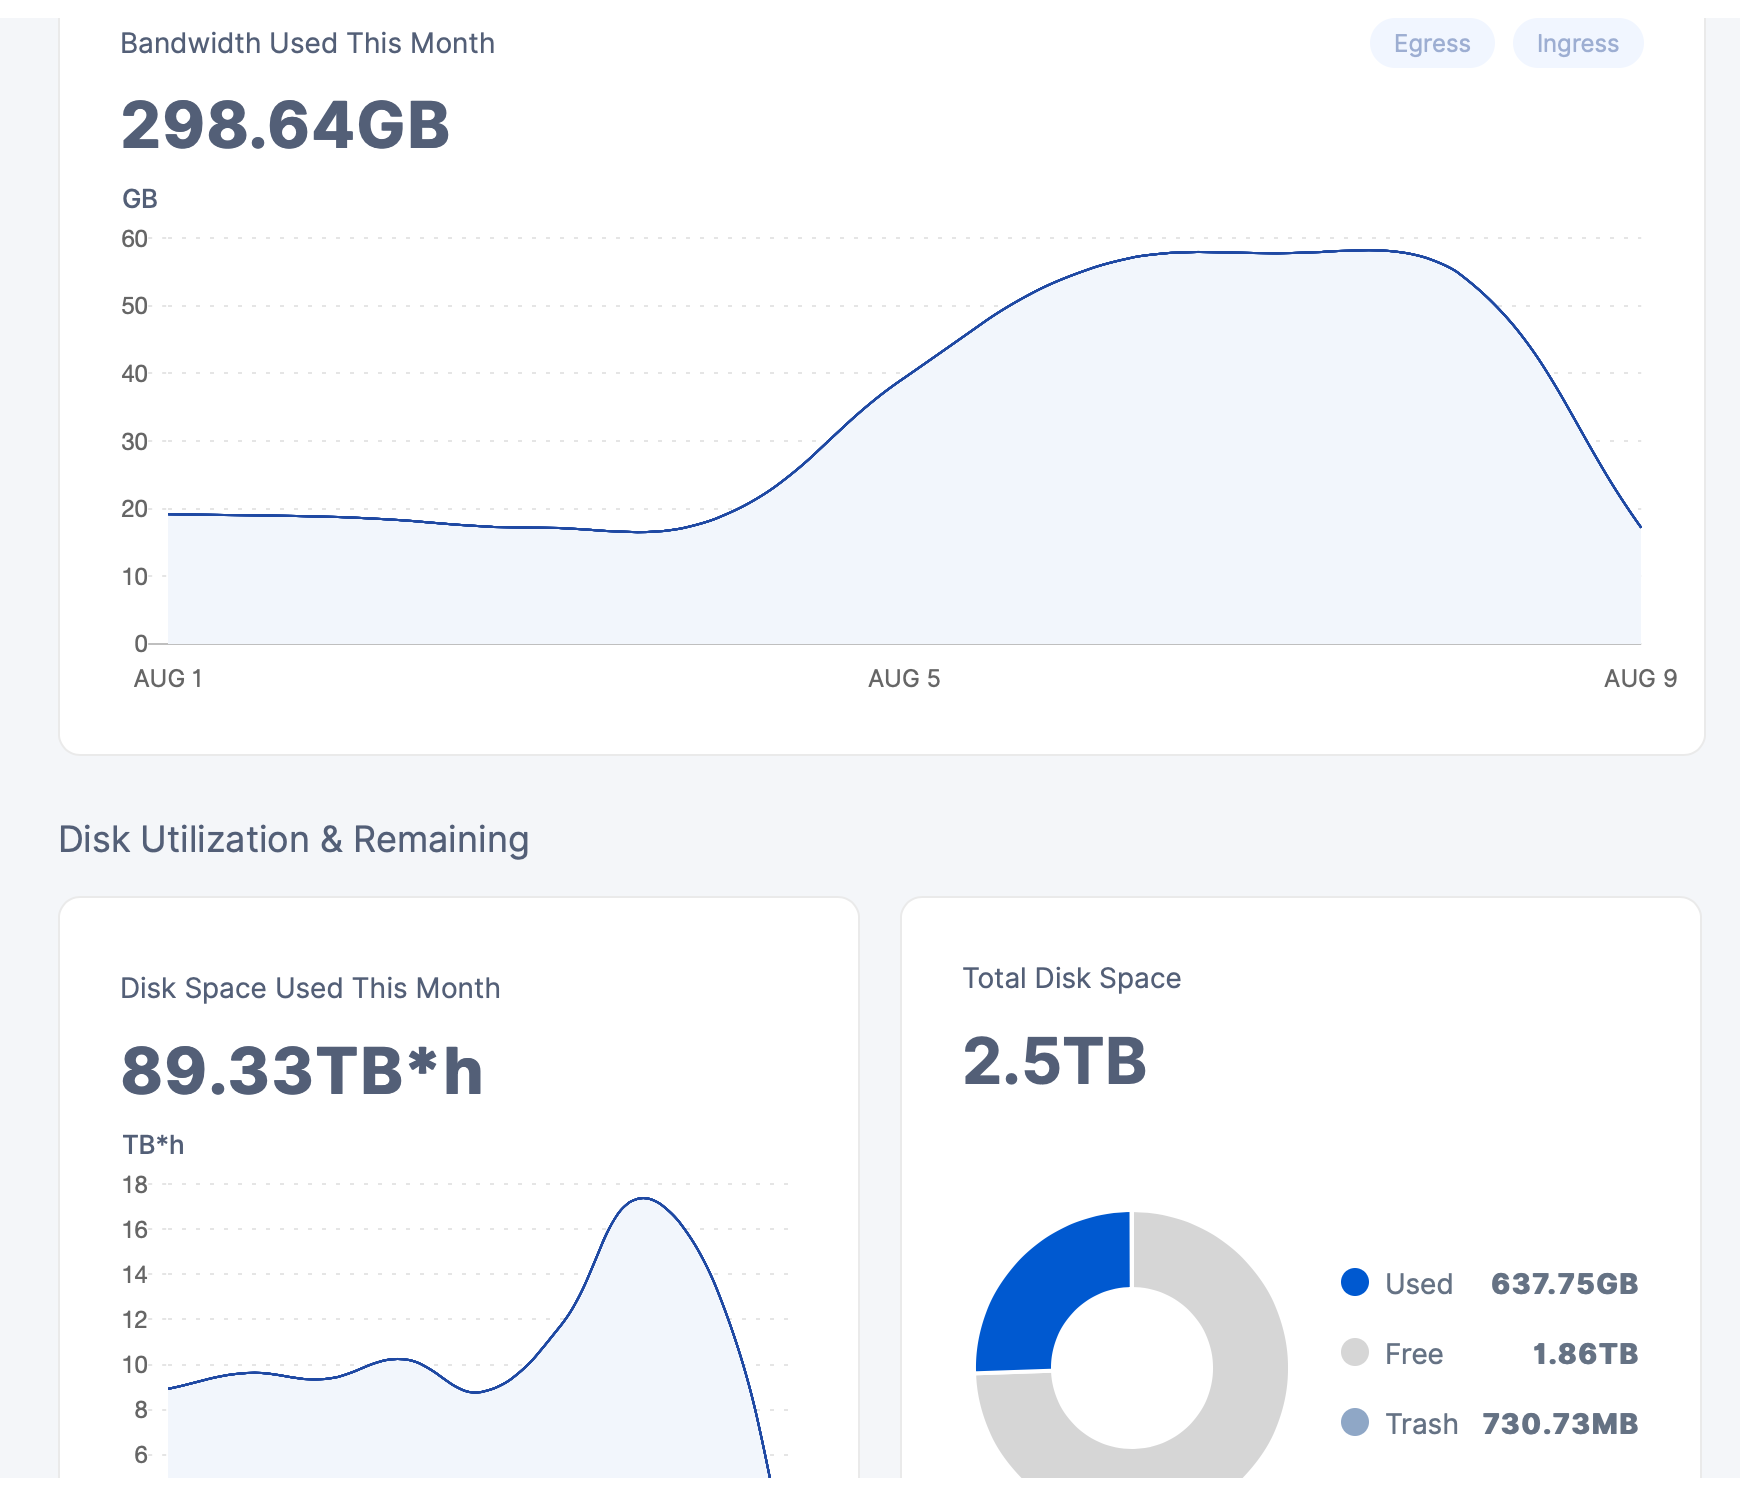
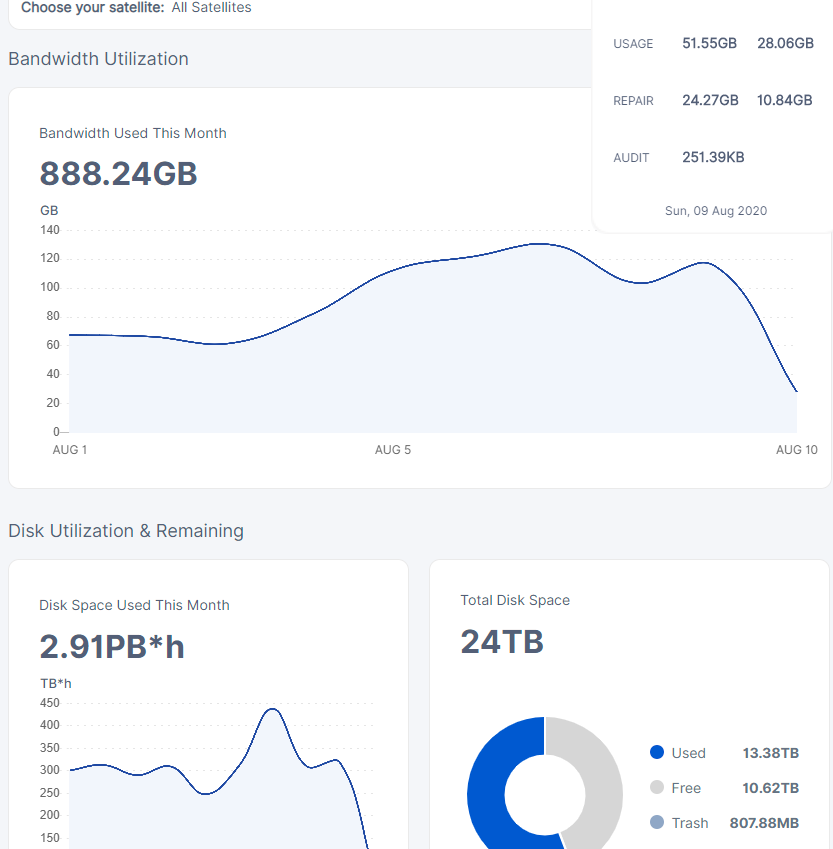
Are you sure that it is only ~2 weeks old? - my 3 weeks old (since 23rd) only gathered ~200GB your node gathered 600+GB - wondering why the difference - is my location that bad? ![]()
@dragonhogan nice numbers!
Node 1 - 71 kb/s /TB stored - that I like - can you remind me how old is it?
Node 2 - only 51 - also great, I like the first one better ![]()
My node is doing much lower…
~25 2 weeks ago
~40 since the egress pick up (excluding the day with satellite fail - 8th) - got bunch of ping errors about that in the log.
My numbers:
| Date | IngressT | EgressT [GB] | StoredT [TB] | egress ‰ | egressT | EgressT [kb/s /TB] |
|---|---|---|---|---|---|---|
| 02.08.2020 | 13.3 | 4.32 | 1.97 | 2.19 | 50.03 | 25.39 |
| 03.08.2020 | 11.62 | 3.27 | 1.98 | 1.65 | 37.86 | 19.12 |
| 04.08.2020 | 19.41 | 5.96 | 1.99 | 2.99 | 68.98 | 34.66 |
| 05.08.2020 | 32.14 | 7.29 | 2.03 | 3.59 | 84.39 | 41.57 |
| 06.08.2020 | 43.68 | 6.71 | 2.06 | 3.26 | 77.66 | 37.7 |
| 07.08.2020 | 49.5 | 7.8 | 2.1 | 3.71 | 90.23 | 42.97 |
| 08.08.2020 | 47.37 | 4.52 | 2.15 | 2.1 | 52.29 | 24.32 |
| 09.08.2020 | 38.48 | 7.68 | 2.17 | 3.54 | 88.91 | 40.97 |
@SGC
Nice 65kb/s / TB stored I wish it would be at least average for all
Difference between Node 1 & Node 3: other ISP; Node 1 is 4 month older than Node 3.
What detailed info do you need? - The current space used?
Current space used would be great - it helps us to compare our bandwidth utilization in terms of used space per node.
Thanx!
i duno i haven’t done my summery of all the data on the thread yet…
my egress was for like the first week of monitoring bandwidth the lowest… if that trend continued i am about to find out… new node numbers are bad… they will always be bad…
think of it a bit like this… if you upload something… then do you download it right away?
it takes time, before people end up downloading their uploads again… and until one passes the avg time it takes for somebody to start downloading their stuff, then egress will be going up… and then when the node reaches a certain age, egress avg over many months will become stable… maybe drop a bit until we get into the years ranges and start hitting major backup restoration events…
those are going to be good… even if not as common, but i’m sure it happens more often than people will like to admit… especially for super massive data sets…
but yeah… unless if something changed then my egress is weak and will continue to be so until the node passes the avg download time… and since it’s mostly test data then might be after the 9 month mark or so…
Now with corrected node sizes. I have nodes on 2 locations, with 3 ISPs, these are now visible in the table.
09.08.2020:
| Node # | location | ISP | size | filled | full | vetted | EGRESS | EGRESS REPAIR | INGRESS | INGRESS REPAIR |
|---|---|---|---|---|---|---|---|---|---|---|
| Node 1 | 1 | 1 | 2.9TB | 2.9TB | y | y | 19,92GB | 12,26GB | 480MB | 155MB |
| Node 2 | 1 | 1 | 5.5TB | 1.21TB | n | y | 4,6GB | 4,74GB | 26,46GB | 8,9GB |
| Node 3 | 1 | 2 | 2.9TB | 2.9TB | y | y | 11,77GB | 1,53GB | 640MB | 215MB |
| Node 4 | 1 | 2 | 1.9TB | 1.9TB | y | y | 7,4GB | 430MB | 600MB | 177MB |
| Node 5 | 1 | 2 | 11TB | 1.09TB | n | y | 4,09GB | 143MB | 27,2GB | 8,9GB |
| Node 6 | 1 | 1 | 7.5TB | 68GB | n | n | 220MB | 0B | 1.71GB | 3.72GB |
| Node 7 | 1 | 2 | 8TB | 72GB | n | n | 270MB | 0B | 1.56GB | 3.75GB |
| Node 8 | 1 | 2 | 0.9TB | 42GB | n | n | 113MB | 0B | 1.6GB | 3.67GB |
| Node 9 | 1 | 1 | 0.9TB | 21GB | n | n | 62MB | 0B | 1.67GB | 3.69GB |
| Node 10 | 2 | 3 | 3.8TB | 3,8TB | y | y | 11.15GB | 14.28GB | 127MB | 60MB |
| Node 11 | 2 | 3 | 5.5TB | 3.79TB | n | y | 14.53GB | 915MB | 25.25GB | 10.89GB |
| Node 12 | 2 | 3 | 0.9TB | 72GB | n | n | 188MB | 0B | 3.04GB | 5.74GB |
I can give you my table in one place so it be ?easier? for you?
Node 1 was spun up in Aug 2019. Node 2 was spun up in Apr 2020