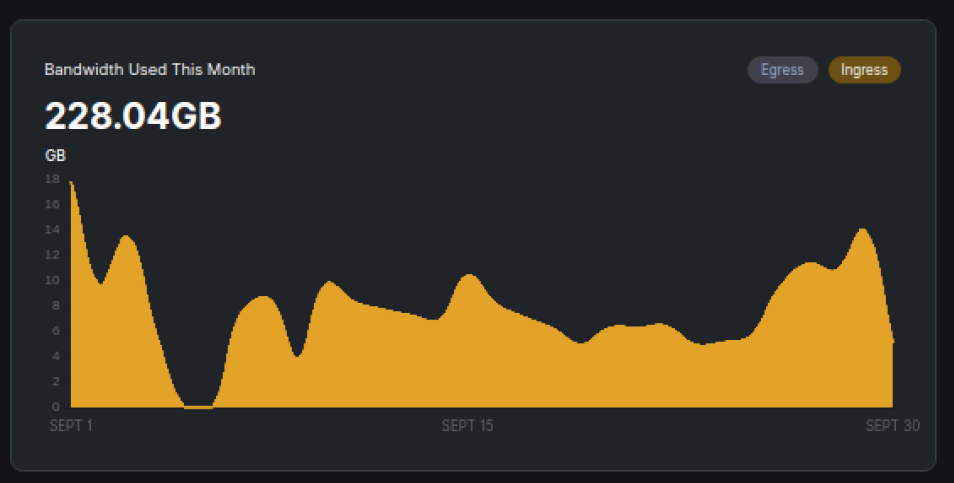
had i done that then he would just have assume that was normal… because i added a second one he noted that his ingress dropped even further…
but yeah having a ton of nodes would essentially make it a bit of a war… tho some claim that its supposedly distributed across the different ip’s in a subnet based on chance not node count on either ip… but from what i could tell in his and my data, it seems to be distributed between the nodes on a subnet… the individual ip is basically irrelevant…
or so my numbers seem to tell me… i can neither confirm nor deny it on that limited data set
if that’s the case, then I’d expect to see that graph show a roughly equivalent number of “added” nodes in the next day or two as those SNOs get their nodes back online?
maybe trump ordered storj to ban china lol
i doubt that, but something similar might look like that…
or some big isp getting annoyed with all the extra traffic and blocking node traffic…
not easy to guess, but i suspect there should be some info about it on the forum…
i cannot help but think it’s related to all the repair traffic… maybe storj had test nodes to support the network and they wanted to perform a dramatic test of what happens to the network if one cuts of a bit part of it…
or a few bad actors had a Bleep ton of ip address all to 1 datacenter or server and got caught and now they had enough of a security level to just drop them all…
the repair sort of indicates that it was a storj decision and very premeditated
Sounds kind of odd that storj would disqualify that many nodes at once but might be possible if, as you say, they found a large number of nodes “cheating” the network.
EDIT:
I just checked the storjnet.info map and my node seems to have disappeared even though it’s still online and working well. I have no way of knowing for sure that the little dot on the map was my node but it was pretty close to where I live and I’m not exactly close to any big cities so it’s fair to assume it was my node.
Might point to a problem with storjnet’s website and not the storj network but that wouldn’t explain the increase in repair traffic…
Maybe someone from the development team can enlighten us ?
not 100% Storj is affected by this as well, but I do know some remote tools are blocked until you say “not now” for the windows 10 ver 2004 if you don’t have an online account.
Had to remote into a few systems to get GP updates to actually take effect at work- annoying to say the least.
It could just be the resolution of the screen grab image that I posted. I’m working on two, 27-inch Full HD monitors set at 1920x1080 (Full HD 1080p). So might just be the fact that the image was captured at a resolution that is just too much for viewing on yours? When I click on the image and the viewer pops up, the image is quite clear.
Regardless, I agree the image viewer functionality could be improved for sure.
yeah my screen is old so no doubt it’s that… but still a zoom and ability to move around wouldn’t make it a problem, but yeah i really should throw it out… most likely costs more power than replacing it would earn in a few years… LCD tsk tsk
If you’re talking about my screen caps then that may be from the 27" 4k at home which, yea, I could see being rather larger if viewed at 1080p or lower.
wouldn’t be a problem if i could zoom further and move the image around, and basically i believe the viewers is most likely just a module on the website, so they should just install a better viewer… because this one is kinda crappy…
but yeah one could solve it with hardware… it could also just make use of both monitors…
if i had one i bet i would have upgraded by now…but when using a dual screen setup it’s not to bad… might add a new one soon tho…
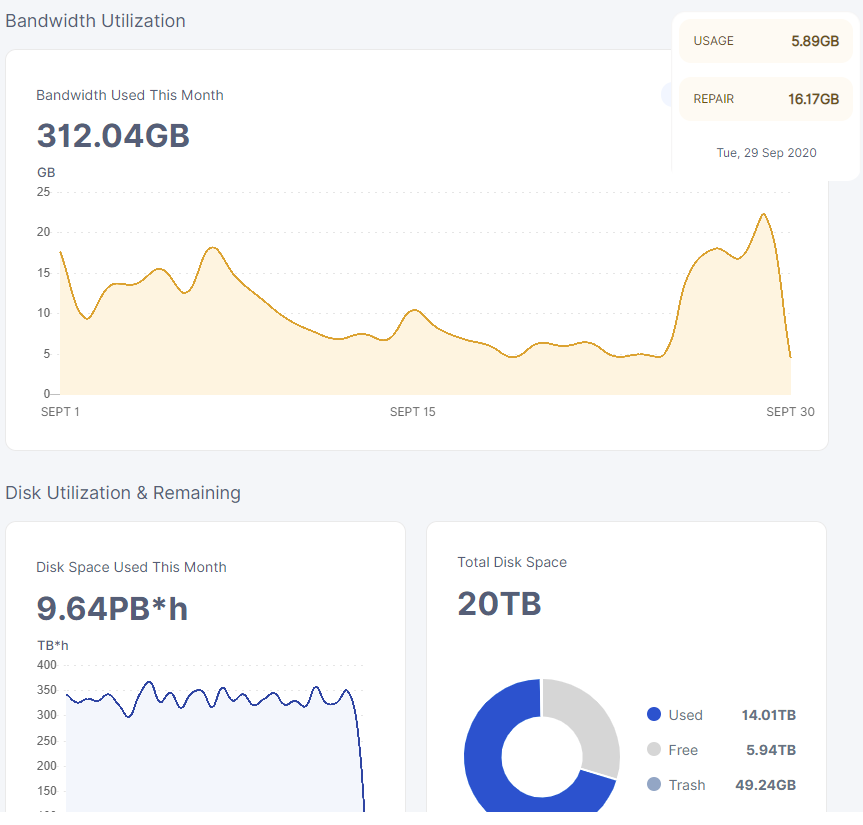
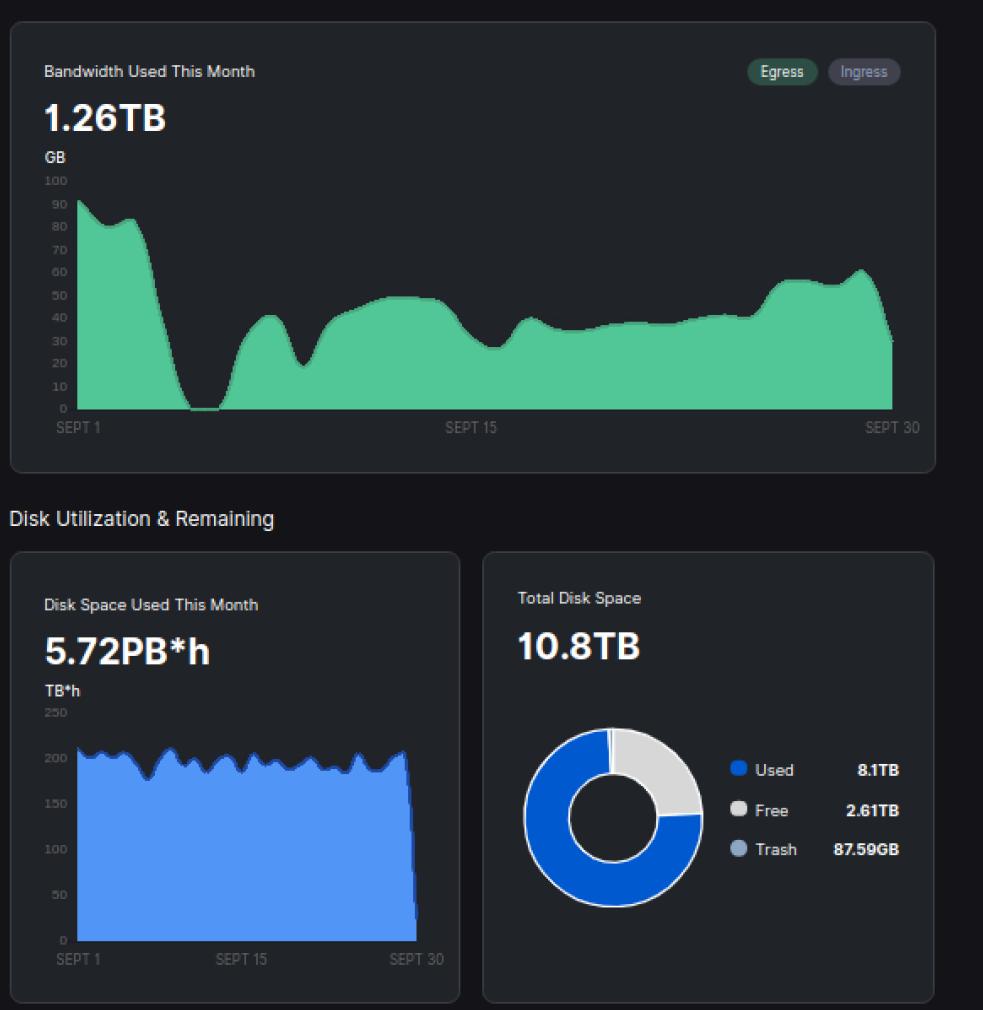
ingress is going up…
so nice that the guy on my subnet got the hint and moved on
I would say that I have similar ingress - small for whole month. Not that you had someone on your subnet. (this node would have to be vetted to grab half of traffic)
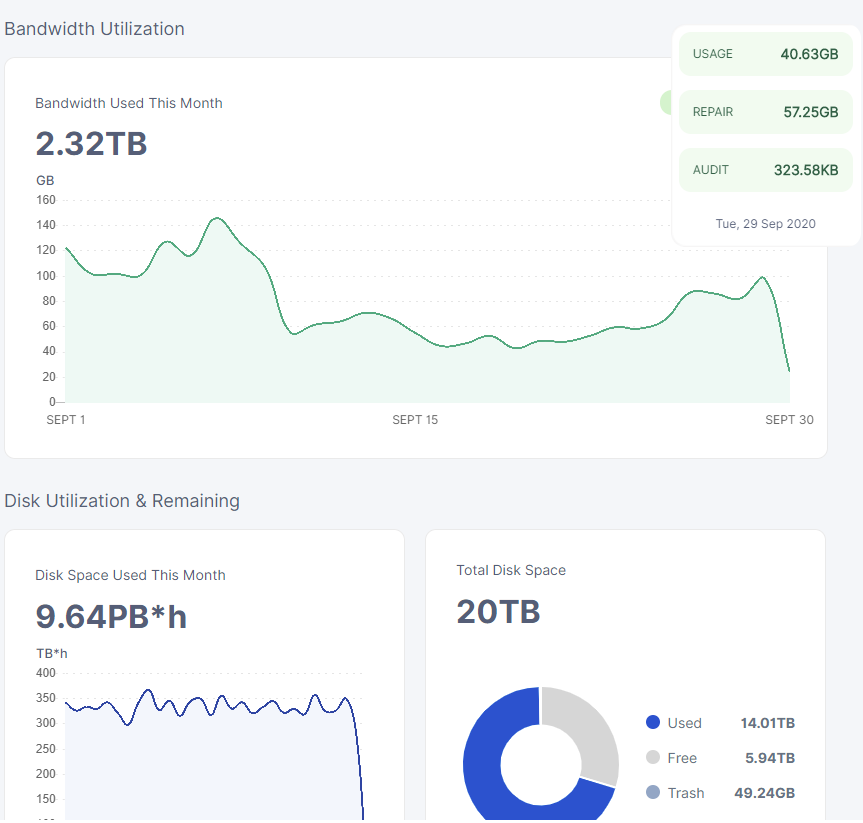
I’ve noted it before in other posts, but just to clarify some of my dips this month:
On 04Sep my fiber line was cut by people digging in my yard, and it wasn’t repaired until 07Sep, which is why my 04-07Sep has valleys/dips
Then on 08Sep that repaired fiber line was cut again by a lawn mower since the repaired line hadn’t been buried yet, so then that was repaired on 09Sep, which again is why there’s a noticeable dip 08-09Sep
well still i can look at our node data and see i got about half and then the sharp rise is when he figured out we were sharing bandwidth and thus most likely got a new ip address…
it’s very clear goes from 17th or 20th where i’m flat lining at about 5gb a day, which is what one of your nodes get… and then at the 28th or 26th or whatever you get about 2x10 and i get about 20
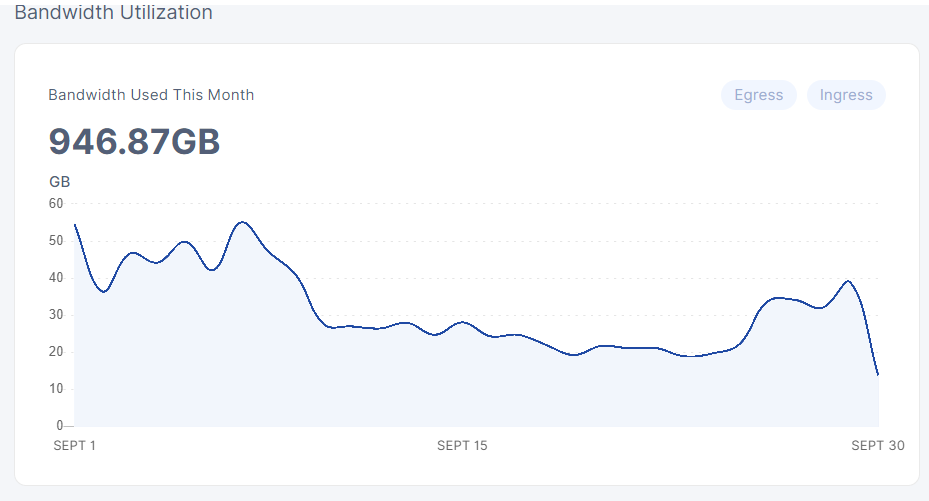
now for the interesting part… did it affect my egress
meh cannot tell… also a kinda random thing… i guess it might not, even if it’s test data…
@shoofar
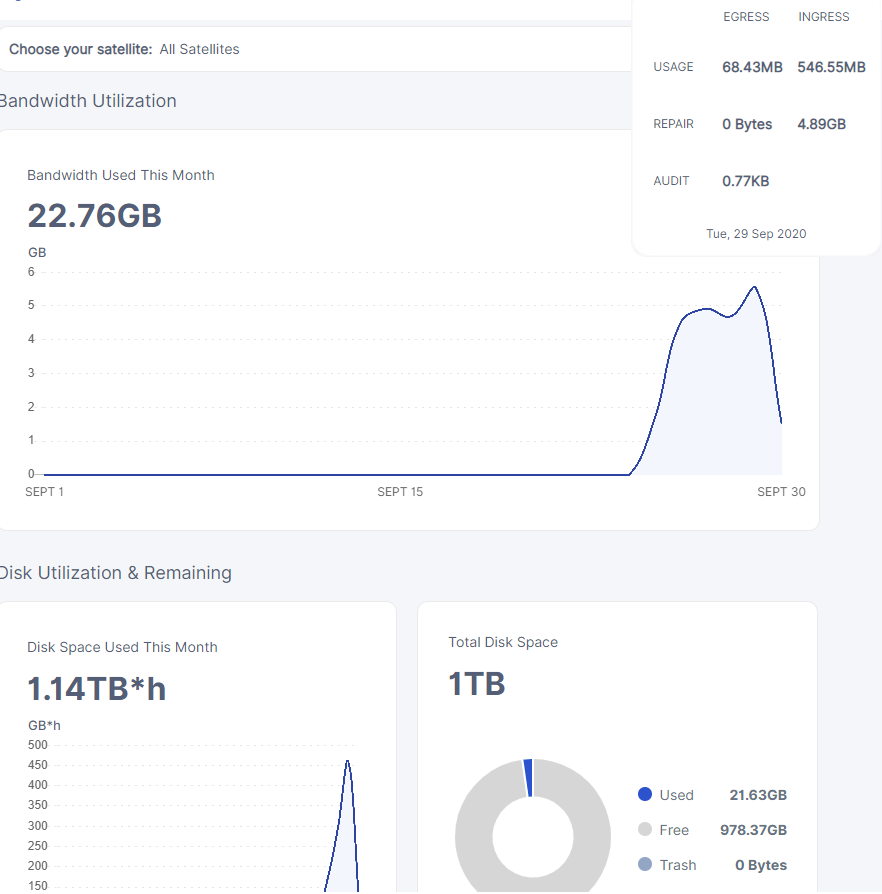
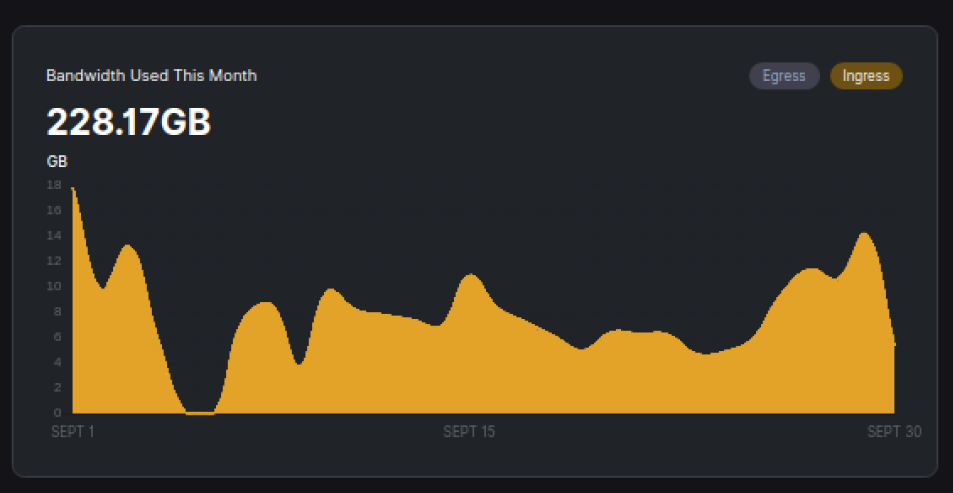
i cannot see your egress graph… i can only see dragonhogans and compared to his nodes my node got about half ingress around the 20th to the 27th or so
not sure how long he has been on my subnet… most likely for 6 weeks i think it was … he popped up on the forum asking why it was so slow
so he got vetted and then ate half my ingress for a week before i noticed… so it’s about 14 days of the graph that should be affected…
maybe 10-14 and the last 3-4 days of the month he had left…
so around the middle mark and onward is where my subnet is shared…
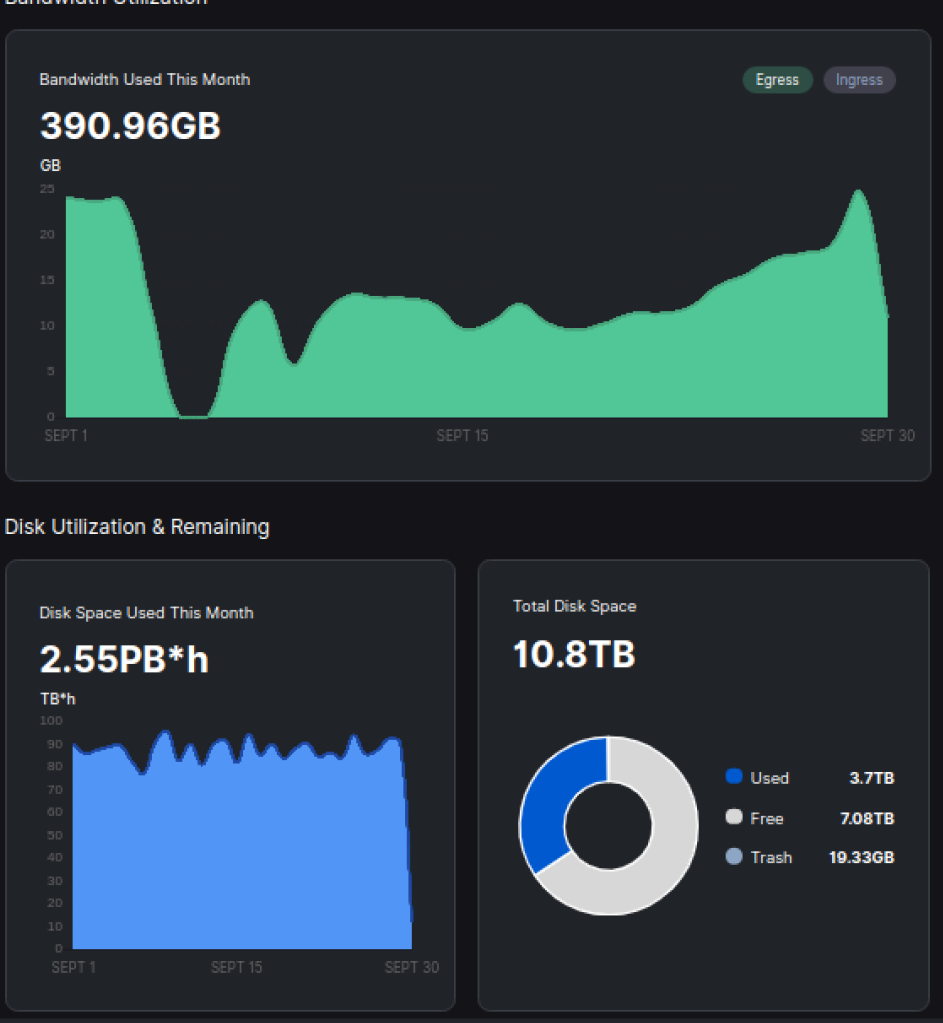
i set up a new node which he noticed as his ingress dropped by another 33% or so
That’s a pull request that I submitted. Let me know if you have any improvements suggestions. When I get time again, I’d like to get uptime information back in the boom table and in the per-node panels now that there’s API data for that.