It seems over the last few days the memory and CPU usage on my pi rig has gone through the roof and holds there.
Any idea what could be causing this? Was there change in the last few days?

Load is like 124 and growing.
ingress has been very high the last few days, i would suspect that something can’t keep up…
this can be a couple of things…
usually its due to HDD latency, but it can also be due to lack of CPU time…
both of these issues will result in RAM usage going up until it runs out, which will then cause issues.
i would suggest you try and reduce the cpu load, if possible…
else you could try to allocate more RAM, again that might not be possible.
which RPI model are you running??
you might simply be the first to post about these issues which many might be seeing with the great increase in ingress over the last few days.
This is a small rig,
Its a Raspberry Pi 3 Model B Plus Rev 1.3 with a 1.8TB USB3 HDD storage
Threw some additional swap into the device as it was OOMing
Load avg now 329 205 141
Generally a storagenode doesn’t require a lot of memory if it can keep up…
i think that your disk is slow…
what did you use for a SWAP drive… if you got an SSD it might be a good idea to drop the SWAP and instead store the storagenode databases on the SSD, this would most likely make it able to run better.
using SWAP also requires some RAM and will also use cpu time…
and can cause wear on the SSD which you don’t want if you will be running the databases over it.
best guess i got is to check your disk latency / utilization and if that is high then its most likely causing the high cpu usage.
in that case move the databases to the OS SSD, just keep in mind if you are using a microSD card, those often don’t have lots of iops nor wear durability, so you will need to make sure whatever SSD type device you are using can handle the wear and iops.
it should atleast be on par with a standard consumer sata SSD or better.
Thank you! Same here, RaspPi 4B with 2 external HDDs (CMR) of 10 TB capacity (around 6 resp. 2 TB in use).
I’ve disabled swap in order to let the SD card not die too fast. This limits performance resources, I guess. Tmp logs are going to the RAM, but are limited to 15 MB, then are stored each 3h to the disk (or on reboot).
Databases stored on a third HDD (SMR), connected via USB-C. Working well, no latency at all recognised. IOPS almost zero.
IOPS on the 2 HDDs going to the roof since 3-4 days. Success rate has dropped to 65%, now up to 78% on the first node with 6 TB data.
So i think USB to sata is the bottleneck. Lot of them USB 2.0 and work slowly. Even 3.0 work not so fast as sata.
USB 3.0 on HDD sata is not bad.
But this JUST started 2 days ago. I think its just demand that maxed out what a PI an do.
throwing some swap seemed to help not OOM (since its only 1G ram)
Thinking of replacing it with a PI4 but worried about heat.
I just want to ask, do you have prometheus working there?Bcs that caused my setup to behave like that
Yes. But why did you have issues?
Prometheus use a lot of resources if there is a lot of data to work with.
Just take a look at top or htop and you will probably see that prometheus eat up all the resources.
If that is a case, You should solve that with configuring storagenode to log just error messages.
And get rid of massive prometheus database.Simply delete prometheus folder and start new era of prometheus, withous sucessrate, and some other details, what cause prometheus behave like that
will give it a try. thx @remo
Not solved. At least stable again at 75% success rate for the bigger node. @remo
How do you determine sucessrate?Bcs the solution I told you, make it unable to show sucessrate.
I forgot to tell you to delete the node.log also.Then delete prometheus database folders, except prometheus.yaml and start again everything.
There is a successrate.sh script and it still shows 25% cancelled downloads.
What does the log file has to do with the running service, which uses RAM/CPU? It’s stored on the disk. Please light my mind. ![]()
I think the issue is IO not actually CPU.
From What is iowait and how does it affect Linux performance? :
I/O wait (iowait) is the percentage of time that the CPU (or CPUs) were idle during which the system had pending disk I/O
100MB\s it may be will if you have one big file. But you obviusly have lot of small files, evena sata coping them very slow about the same speed. it is because of seek time to find locations and so one. each small file need to search on disk.
So it might be not the fastest disk, right? ![]()
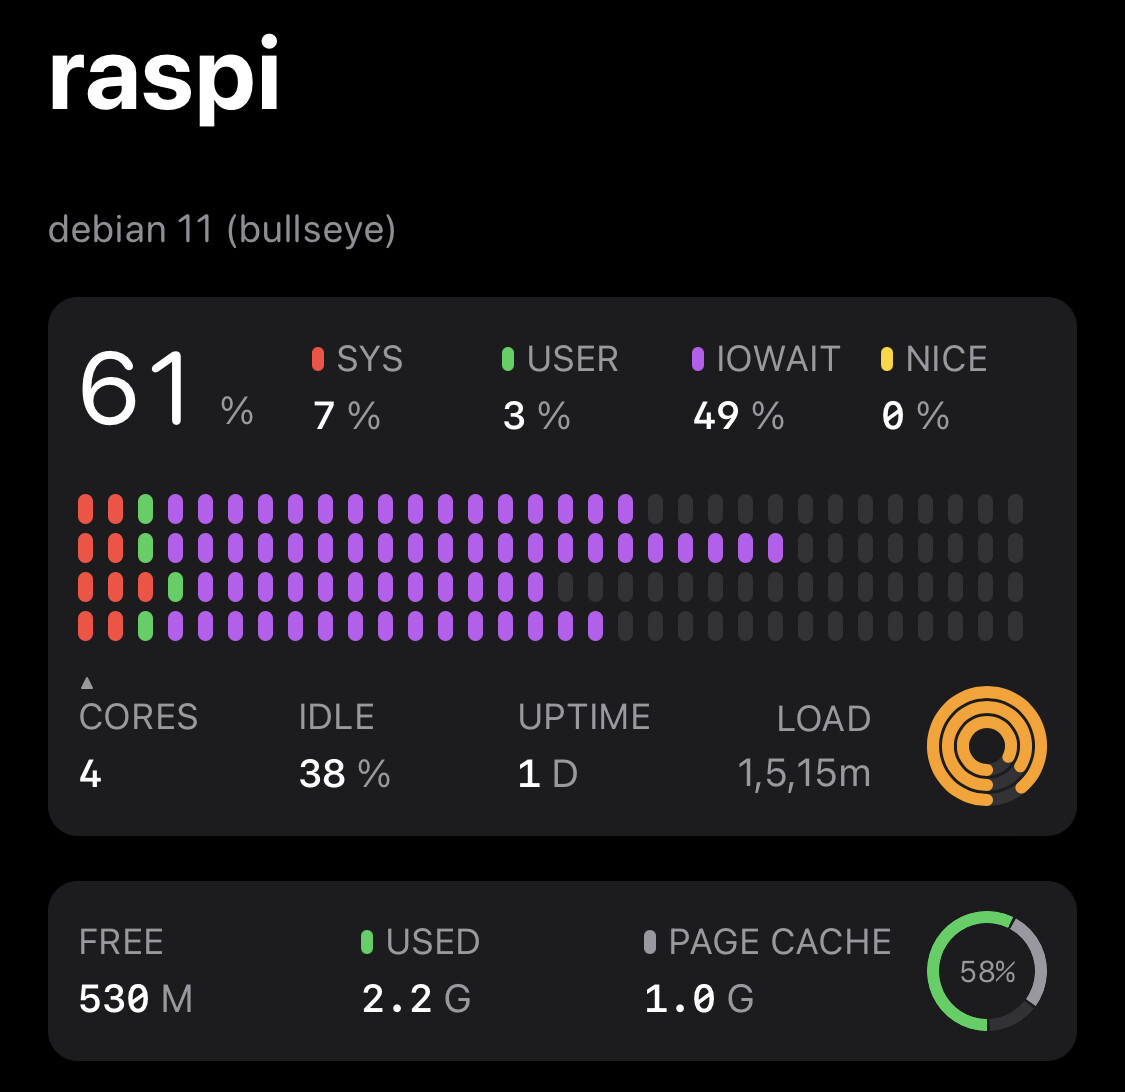
ssd will give you big speed, but every HDD will be slow. USB also add conversion level and add IO wait. As I see in your picture above IO wait is 49% so it half of time waiting responce from disk and do nothing. Also it is storage node it mixing read and write all the time.
wha ICY box model do you have?