Running Linux
I moved my note to a larger drive last night.
I stopped docker with the -t 300 command then i moved everything using rsync.
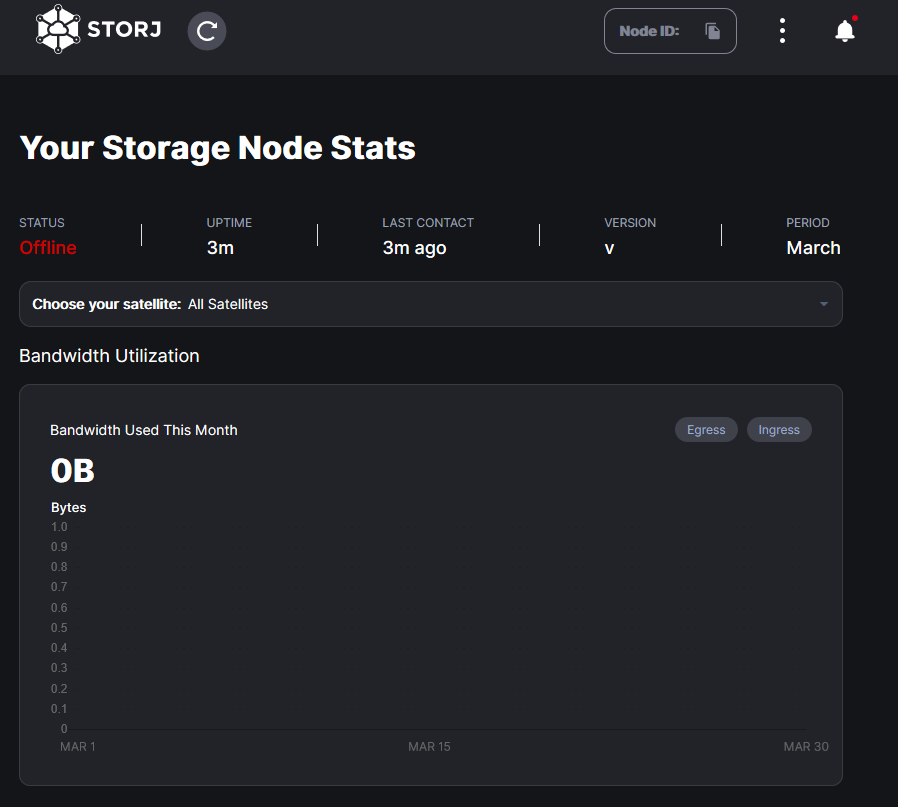
After changing the mount entries in fstab i rebooted and everything looked normal untill i went to the web page dashboard The “Bandwidth used this month” is empty it has a running total but no graph.
I’m seeing the following error in the logs:
2019-12-07T13:42:33.430Z ERROR piecestore failed to add bandwidth usage {“error”: “bandwidthdb error: database disk image is malformed”, “errorVerbose”: “bandwidthdb error: database disk image is malformed\n\tstorj.io/storj/storagenode/storagenodedb.(*bandwidthDB).Add:59\n\tstorj.io/storj/storagenode/piecestore.(*Endpoint).saveOrder:632\n\tstorj.io/storj/storagenode/piecestore.(*Endpoint).doUpload:379\n\tstorj.io/storj/storagenode/piecestore.(*drpcEndpoint).Upload:176\n\tstorj.io/storj/pkg/pb.DRPCPiecestoreDescription.Method.func1:830\n\tstorj.io/drpc/drpcserver.(*Server).doHandle:175\n\tstorj.io/drpc/drpcserver.(*Server).HandleRPC:153\n\tstorj.io/drpc/drpcserver.(*Server).ServeOne:114\n\tstorj.io/drpc/drpcserver.(*Server).Serve.func2:147\n\tstorj.io/drpc/drpcctx.(*Tracker).track:51”}
I just got the same error message and am attempting to repair the databases. Is it possible that something in one of the new updates could have triggered this?
Nothing at all has changed with the node, have plenty of free space and there haven’t been any reboots or stopping of the storagenode other than the ones done automatically by watchtower for updates.
How long did the above listed directions take to do “sqlite3 /storage/bandwidth.db “.read /storage/dump_all_notrans.sql”” that part? I’m running on dual xeon processors and have 72gb of ram. After i hit enter with the above command the terminal window is just sitting there. Is this expected behavior or do you think it is stuck?
If it normally takes a few min to run that command I will feel better about it. If it’s supposed to be near instant I might be in trouble.
Ok, so it is increasing in size. So that’s good. If the only db that is throwing errors in the logs is bandwidth.db, that should be the only one I need to repair right?
You need to scan all the databases to just check and see if they all return ok and without errors. If there are errors then you have to backup, fix and replace the database with errors. The log error message just gives you a direction to take and db file to look at. That doesn’t mean it’s the only file with errors.
Seems that i have the same problem.
I have the newest Storj Docker Image. The Node runs for more than 13Months until now.
I do nothing and today i see that there are some problems.
(Linux / Raspberry)