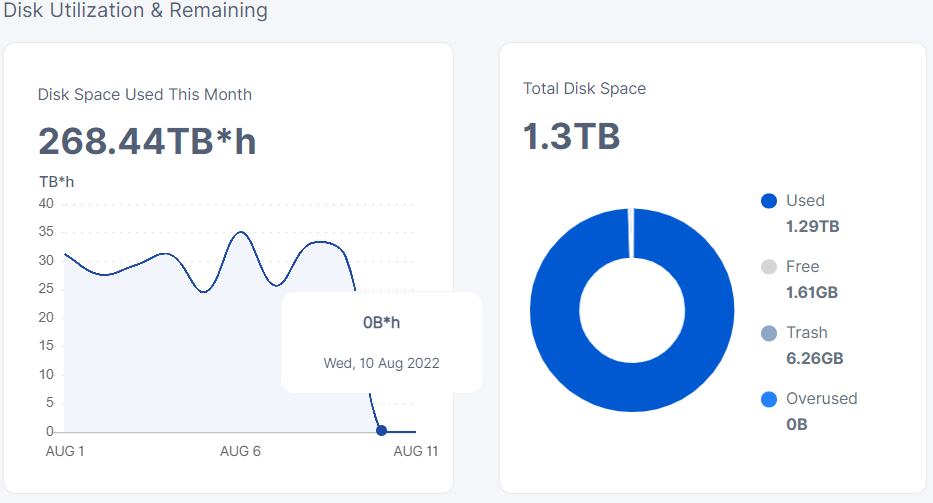
The dashboard is showing 0 disk space used in the last 3 days but the bandwidth is reporting fine? Bug with update? or what?

I have the same problem on all my nodes since yesterday.
okay well good to know its not just me.
1 Like
I only have one node on testnet and it too has not shown disk space since 10 August…
I do not see only since August 10
Reported to the team. Seems reporting performed longer than usual.
Hello,
Same for me since V1.60.3
We’ve seen this happen in the past as well. Sometimes satellites get a little behind updating these stats. But they will retroactively correct it.
Ok thanks for your reply

Can one of you please query the storage node logs for any errors that might look like this:
nodestats:cache Get stats query failed
output with docker logs container | grep nodestats
2022-08-08T13:23:34.644Z	ERROR	nodestats:cache	Get stats query failed	{"Process": "storagenode", "error": "nodestats: unable to connect to the satellite 12rfG3sh9NCWiX3ivPjq2HtdLmbqCrvHVEzJubnzFzosMuawymB: rpc: tcp connector failed: rpc: dial tcp: lookup europe-north-1.tardigrade.io on 127.0.0.11:53: read udp 127.0.0.1:37300->127.0.0.11:53: i/o timeout", "errorVerbose": "nodestats: unable to connect to the satellite 12rfG3sh9NCWiX3ivPjq2HtdLmbqCrvHVEzJubnzFzosMuawymB: rpc: tcp connector failed: rpc: dial tcp: lookup europe-north-1.tardigrade.io on 127.0.0.11:53: read udp 127.0.0.1:37300->127.0.0.11:53: i/o timeout\n\tstorj.io/storj/storagenode/nodestats.(*Service).dial:156\n\tstorj.io/storj/storagenode/nodestats.(*Service).GetReputationStats:66\n\tstorj.io/storj/storagenode/nodestats.(*Cache).CacheReputationStats.func1:152\n\tstorj.io/storj/storagenode/nodestats.(*Cache).satelliteLoop:259\n\tstorj.io/storj/storagenode/nodestats.(*Cache).CacheReputationStats:151\n\tstorj.io/storj/storagenode/nodestats.(*Cache).Run.func2:118\n\tstorj.io/common/sync2.(*Cycle).Run:160\n\tstorj.io/common/sync2.(*Cycle).Start.func1:77\n\tgolang.org/x/sync/errgroup.(*Group).Go.func1:57"}
2022-08-10T21:24:14.050Z	ERROR	nodestats:cache	Get disk space usage query failed	{"Process": "storagenode", "error": "nodestats: unable to connect to the satellite 121RTSDpyNZVcEU84Ticf2L1ntiuUimbWgfATz21tuvgk3vzoA6: rpc: tcp connector failed: rpc: dial tcp: lookup ap1.storj.io on 127.0.0.11:53: read udp 127.0.0.1:35180->127.0.0.11:53: i/o timeout", "errorVerbose": "nodestats: unable to connect to the satellite 121RTSDpyNZVcEU84Ticf2L1ntiuUimbWgfATz21tuvgk3vzoA6: rpc: tcp connector failed: rpc: dial tcp: lookup ap1.storj.io on 127.0.0.11:53: read udp 127.0.0.1:35180->127.0.0.11:53: i/o timeout\n\tstorj.io/storj/storagenode/nodestats.(*Service).dial:156\n\tstorj.io/storj/storagenode/nodestats.(*Service).GetDailyStorageUsage:107\n\tstorj.io/storj/storagenode/nodestats.(*Cache).CacheSpaceUsage.func1:175\n\tstorj.io/storj/storagenode/nodestats.(*Cache).satelliteLoop:259\n\tstorj.io/storj/storagenode/nodestats.(*Cache).CacheSpaceUsage:174\n\tstorj.io/storj/storagenode/nodestats.(*Cache).Run.func3:130\n\tstorj.io/common/sync2.(*Cycle).Run:160\n\tstorj.io/common/sync2.(*Cycle).Start.func1:77\n\tgolang.org/x/sync/errgroup.(*Group).Go.func1:57"}
2022-08-11T13:23:50.891Z	ERROR	nodestats:cache	Get stats query failed	{"Process": "storagenode", "error": "nodestats: unable to connect to the satellite 1wFTAgs9DP5RSnCqKV1eLf6N9wtk4EAtmN5DpSxcs8EjT69tGE: rpc: tcp connector failed: rpc: dial tcp: lookup saltlake.tardigrade.io on 127.0.0.11:53: read udp 127.0.0.1:53062->127.0.0.11:53: i/o timeout; nodestats: unable to connect to the satellite 12EayRS2V1kEsWESU9QMRseFhdxYxKicsiFmxrsLZHeLUtdps3S: rpc: tcp connector failed: rpc: dial tcp: lookup us1.storj.io on 127.0.0.11:53: read udp 127.0.0.1:43914->127.0.0.11:53: i/o timeout", "errorVerbose": "group:\n--- nodestats: unable to connect to the satellite 1wFTAgs9DP5RSnCqKV1eLf6N9wtk4EAtmN5DpSxcs8EjT69tGE: rpc: tcp connector failed: rpc: dial tcp: lookup saltlake.tardigrade.io on 127.0.0.11:53: read udp 127.0.0.1:53062->127.0.0.11:53: i/o timeout\n\tstorj.io/storj/storagenode/nodestats.(*Service).dial:156\n\tstorj.io/storj/storagenode/nodestats.(*Service).GetReputationStats:66\n\tstorj.io/storj/storagenode/nodestats.(*Cache).CacheReputationStats.func1:152\n\tstorj.io/storj/storagenode/nodestats.(*Cache).satelliteLoop:259\n\tstorj.io/storj/storagenode/nodestats.(*Cache).CacheReputationStats:151\n\tstorj.io/storj/storagenode/nodestats.(*Cache).Run.func2:118\n\tstorj.io/common/sync2.(*Cycle).Run:160\n\tstorj.io/common/sync2.(*Cycle).Start.func1:77\n\tgolang.org/x/sync/errgroup.(*Group).Go.func1:57\n--- nodestats: unable to connect to the satellite 12EayRS2V1kEsWESU9QMRseFhdxYxKicsiFmxrsLZHeLUtdps3S: rpc: tcp connector failed: rpc: dial tcp: lookup us1.storj.io on 127.0.0.11:53: read udp 127.0.0.1:43914->127.0.0.11:53: i/o timeout\n\tstorj.io/storj/storagenode/nodestats.(*Service).dial:156\n\tstorj.io/storj/storagenode/nodestats.(*Service).GetReputationStats:66\n\tstorj.io/storj/storagenode/nodestats.(*Cache).CacheReputationStats.func1:152\n\tstorj.io/storj/storagenode/nodestats.(*Cache).satelliteLoop:259\n\tstorj.io/storj/storagenode/nodestats.(*Cache).CacheReputationStats:151\n\tstorj.io/storj/storagenode/nodestats.(*Cache).Run.func2:118\n\tstorj.io/common/sync2.(*Cycle).Run:160\n\tstorj.io/common/sync2.(*Cycle).Start.func1:77\n\tgolang.org/x/sync/errgroup.(*Group).Go.func1:57"}
I do not have such an error. But graph is not updated.
Some of my nodes updated graph.
1 Like
docker logs testnode 2>&1 | grep "Get stats query failed" -c
129
example
2022-08-02T05:16:46.675Z	ERROR	nodestats:cache	Get stats query failed	{"Process": "storagenode", "error": "nodestats: unable to connect to the satellite 12ZQbQ8WWFEfKNE9dP78B1frhJ8PmyYmr8occLEf1mQ1ovgVWy: rpc: tcp connector failed: rpc: dial tcp 49.12.176.190:7777: connect: connection refused", "errorVerbose": "nodestats: unable to connect to the satellite 12ZQbQ8WWFEfKNE9dP78B1frhJ8PmyYmr8occLEf1mQ1ovgVWy: rpc: tcp connector failed: rpc: dial tcp 49.12.176.190:7777: connect: connection refused\n\tstorj.io/storj/storagenode/nodestats.(*Service).dial:156\n\tstorj.io/storj/storagenode/nodestats.(*Service).GetReputationStats:66\n\tstorj.io/storj/storagenode/nodestats.(*Cache).CacheReputationStats.func1:152\n\tstorj.io/storj/storagenode/nodestats.(*Cache).satelliteLoop:259\n\tstorj.io/storj/storagenode/nodestats.(*Cache).CacheReputationStats:151\n\tstorj.io/storj/storagenode/nodestats.(*Cache).Run.func2:118\n\tstorj.io/common/sync2.(*Cycle).Run:160\n\tstorj.io/common/sync2.(*Cycle).Start.func1:77\n\tgolang.org/x/sync/errgroup.(*Group).Go.func1:57"}
2022-08-02T09:17:31.432Z	ERROR	nodestats:cache	Get stats query failed	{"Process": "storagenode", "error": "nodestats: unable to connect to the satellite 12ZQbQ8WWFEfKNE9dP78B1frhJ8PmyYmr8occLEf1mQ1ovgVWy: rpc: tcp connector failed: rpc: dial tcp 49.12.176.190:7777: connect: connection refused", "errorVerbose": "nodestats: unable to connect to the satellite 12ZQbQ8WWFEfKNE9dP78B1frhJ8PmyYmr8occLEf1mQ1ovgVWy: rpc: tcp connector failed: rpc: dial tcp 49.12.176.190:7777: connect: connection refused\n\tstorj.io/storj/storagenode/nodestats.(*Service).dial:156\n\tstorj.io/storj/storagenode/nodestats.(*Service).GetReputationStats:66\n\tstorj.io/storj/storagenode/nodestats.(*Cache).CacheReputationStats.func1:152\n\tstorj.io/storj/storagenode/nodestats.(*Cache).satelliteLoop:259\n\tstorj.io/storj/storagenode/nodestats.(*Cache).CacheReputationStats:151\n\tstorj.io/storj/storagenode/nodestats.(*Cache).Run.func2:118\n\tstorj.io/common/sync2.(*Cycle).Run:160\n\tstorj.io/common/sync2.(*Cycle).Start.func1:77\n\tgolang.org/x/sync/errgroup.(*Group).Go.func1:57"}
2022-08-02T13:17:38.816Z	ERROR	nodestats:cache	Get stats query failed	{"Process": "storagenode", "error": "nodestats: unable to connect to the satellite 12ZQbQ8WWFEfKNE9dP78B1frhJ8PmyYmr8occLEf1mQ1ovgVWy: rpc: tcp connector failed: rpc: dial tcp 49.12.176.190:7777: connect: connection refused", "errorVerbose": "nodestats: unable to connect to the satellite 12ZQbQ8WWFEfKNE9dP78B1frhJ8PmyYmr8occLEf1mQ1ovgVWy: rpc: tcp connector failed: rpc: dial tcp 49.12.176.190:7777: connect: connection refused\n\tstorj.io/storj/storagenode/nodestats.(*Service).dial:156\n\tstorj.io/storj/storagenode/nodestats.(*Service).GetReputationStats:66\n\tstorj.io/storj/storagenode/nodestats.(*Cache).CacheReputationStats.func1:152\n\tstorj.io/storj/storagenode/nodestats.(*Cache).satelliteLoop:259\n\tstorj.io/storj/storagenode/nodestats.(*Cache).CacheReputationStats:151\n\tstorj.io/storj/storagenode/nodestats.(*Cache).Run.func2:118\n\tstorj.io/common/sync2.(*Cycle).Run:160\n\tstorj.io/common/sync2.(*Cycle).Start.func1:77\n\tgolang.org/x/sync/errgroup.(*Group).Go.func1:57"}
2022-08-02T17:19:40.772Z	ERROR	nodestats:cache	Get stats query failed	{"Process": "storagenode", "error": "nodestats: unable to connect to the satellite 12ZQbQ8WWFEfKNE9dP78B1frhJ8PmyYmr8occLEf1mQ1ovgVWy: rpc: tcp connector failed: rpc: dial tcp 49.12.176.190:7777: connect: connection refused", "errorVerbose": "nodestats: unable to connect to the satellite 12ZQbQ8WWFEfKNE9dP78B1frhJ8PmyYmr8occLEf1mQ1ovgVWy: rpc: tcp connector failed: rpc: dial tcp 49.12.176.190:7777: connect: connection refused\n\tstorj.io/storj/storagenode/nodestats.(*Service).dial:156\n\tstorj.io/storj/storagenode/nodestats.(*Service).GetReputationStats:66\n\tstorj.io/storj/storagenode/nodestats.(*Cache).CacheReputationStats.func1:152\n\tstorj.io/storj/storagenode/nodestats.(*Cache).satelliteLoop:259\n\tstorj.io/storj/storagenode/nodestats.(*Cache).CacheReputationStats:151\n\tstorj.io/storj/storagenode/nodestats.(*Cache).Run.func2:118\n\tstorj.io/common/sync2.(*Cycle).Run:160\n\tstorj.io/common/sync2.(*Cycle).Start.func1:77\n\tgolang.org/x/sync/errgroup.(*Group).Go.func1:57"}
some of mine got the graph from the 10th… others flatline the last few days…
can’t spot any pattern as to why…
the few oldest nodes seems to all have the graph… but as i scan through other later additions it just seems random.
always the same tho… graph to the 10th or flatlined for like 3 days or so…
no wait just checked… flatlines the 10th and then the 11 th…
while the second pattern is just graph ends in the present with 0 today… but not sure if that is abnormal.


@clement In the last release we had 2 code changes on the satellite side that might cause this:
f2f046a satellite/satellitedb: add interval_end_time column to accounting_rollups table
d1d15cb satellite: return interval_end_time in DailyStorageUsage endpoint
I looked into my sqlite db storage_usage.db. The last day I have data for is the 10th. It looks like since the deployment the storage node is unable to get the data from the satellite.
Edit: I spend a few more minutes to take a look into the satellite DB. The 2 queries I used here are:
SELECT *
FROM accounting_rollups
ORDER BY accounting_rollups.interval_end_time DESC
LIMIT 10

SELECT *
FROM accounting_rollups
ORDER BY accounting_rollups.start_time DESC
LIMIT 10
I see a pattern in the data. Up until the 10th the interval_end_time is filled. From the 10th to the current day the interval_end_time is set with a default value 01/01/01 00:00 and I would guess that default format is the reason it fails.

