yes, mine too. But it’s possible that they use something very slow like network filesystem connected over internet.
Is there a method to check filewalker status on windows? I can only see it in the logs when the service has been restarted. I just left the service running for 5 days and didn’t see any logs about it finishing. I disabled lazy as well.
Good to know… It’s a USB disk but not sure why it’s that slow… Maybe RPI has not enough power
The USB stick is used for DBs, not to store blobs, right?
So, you have a problem only with a disk performance, not with databases.
Thanks for the quick reply. That is what I meant by I don’t see anything in the logs pertaining to filewalker. Nothing shows up for used-space-filewalker or gc-filewalker *In the last 7 days. Only retain (when the service is restarted), then collector and trash. My drive is still storing 4TB more than Storj says I am.
Everything is on the USB HDD… That RPI only has a small SD card and the external HDD
You should have records from a used-space-filewalker, unless you disabled it.
And you should have a gc-filewalker before the retain filewalker, because the last one is moves what’s found by gc-filewalker to the trash.
The collector filewalker is working itself, it’s independent of other filewalkers (thus, it could throw errors like file not found).
the piece:trash filewalker is independent too, it only cleans the trash.
Last time gc-filewalker showed was 3/8
206630:2024-03-08T06:31:59-06:00 INFO
lazyfilewalker.gc-filewalker subprocess exited with status {“satelliteID”:
“121RTSDpyNZVcEU84Ticf2L1ntiuUimbWgfATz21tuvgk3vzoA6”, “status”: 1, “error”: “exit status 1”}
and last time used-filewalker showed was 3/23 . The service was 100% up from 3/24-3/28 and I restarted it 3/29. I made the change to disable lazy filewalker around 3/24 but that was the only change I’ve made. There was no gc-filewalker before this retain since 3/8
{“error”: “retain: filewalker: context canceled”, “errorVerbose”: “retain: filewalker: context canceled\n\tstorj.io/sto
rj/storagenode/pieces.(*FileWalker).WalkSatellitePieces:69\n\tstorj.io/storj/storagenode/pieces.(*FileWalker).WalkSatel
litePiecesToTrash:146\n\tstorj.io/storj/storagenode/pieces.(*Store).SatellitePiecesToTrash:562\n\tstorj.io/storj/storag
enode/retain.(*Service).retainPieces:325\n\tstorj.io/storj/storagenode/retain.(*Service).Run.func2:221\n\tgolang.org/x/
sync/errgroup.(*Group).Go.func1:75”}
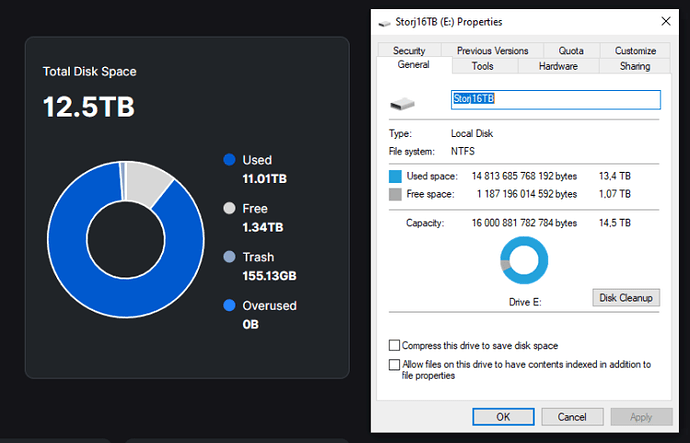
Also this is what the space discrepancy looks like. The drive is dedicated to storj. After removing the old satellites, I expected it to go down more but only ~200GB was removed. Is there a more manual method to compare how much I should be storing from the satellite vs what I currently am and remove the extra data? Because the automated way doesn’t seem to be working. I’ve noticed this discrepancy for 1-2 months now.
you need to check logs further to see the reason. But I guess that’s context canceled = read timeout = disk is too slow to respond timely.
Until all filewalkers will be successful finished for every trusted satellite, the discrepancy will remain.
Right now I can only suggest to disable a lazy mode
Yes, it was a context cancelled but I haven’t had any of those errors recently. I disabled lazy filewalker around 3/24 and waited 4.5 days for it to finish and nothing. I’ll wait again but a manual method would be nice. Also would be nice to be able to tell status of filewalker while it is running. Does seem like quite a few people are having this issue since December. I only noticed mine around 2 months ago but I imagine it had been for some time before I noticed.
I was getting a lot of database locked errors as well but I fixed those by going through the corrupt DB restore method. My bandwidth.DB had somehow gotten to 14GB which seems pretty large from what I’ve read, although it is on an ssd. Maybe this fix helped. I’ll report back when I get anything from filewalker.
2 posts were split to a new topic: From 3 days the Average Disk Spase Used is not updated
You may track it:
You should have “start” and “finish” (or “Prepare” and “Move” for retain) for every satellite.
this is the reason, because all filewalkers should update a database, to allow the dashboard take this info from there.
update still running: (started iotop with -a and its running for ~15 min and read about 3.2GB in that time)
free space is still unchanged
/dev/sda1 9.1T 9.0T 45G 100% /storewould be nice to get a manual method of checking the free space compared to used space with progress like @Shab said
imo this stupid bug should have highest priority, guess there many nodes out there not even know they have this problem
Yes, the size of the Bloom filter could be not enough for your node (it depends on the number of pieces), see
But since you have fatal errors, your node likely restarts and loose the received Bloom filter (it’s stored in the memory), so perhaps the garbage collection is rarely happen for your node.
This should be fixed with this feature:
At least it seems that this information is available from version 1.98. on:
If the size of the Bloom filter could be not enough, then storjlabs need to return direct deletions. In the days of direct deletions, there were no problems.
Status update @Alexey:
Apparently “used-space-filewalker” finished successfully but still Disk Discrepancy:
Any ideas?
There doesn’t appear to be a successful finish for US1. It’s probably still running right now.


