I recently updated my Storj node to version 1.148.3 on Windows. Since the update, I’ve noticed a discrepancy in the storage statistics.
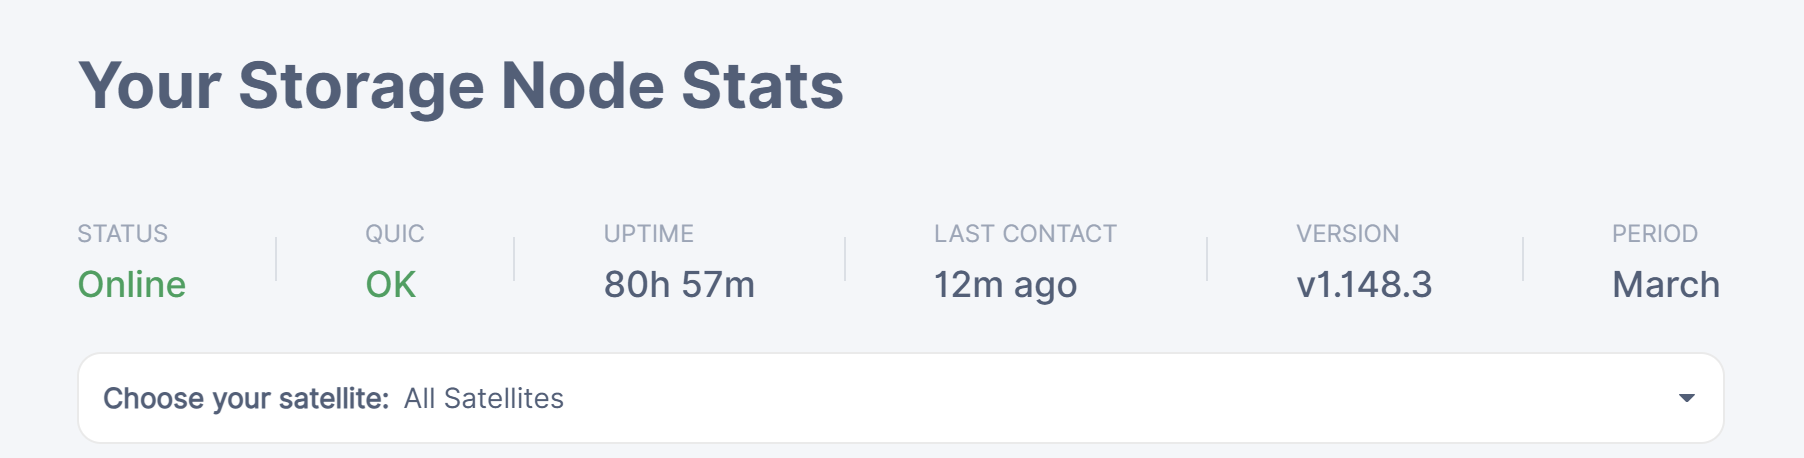
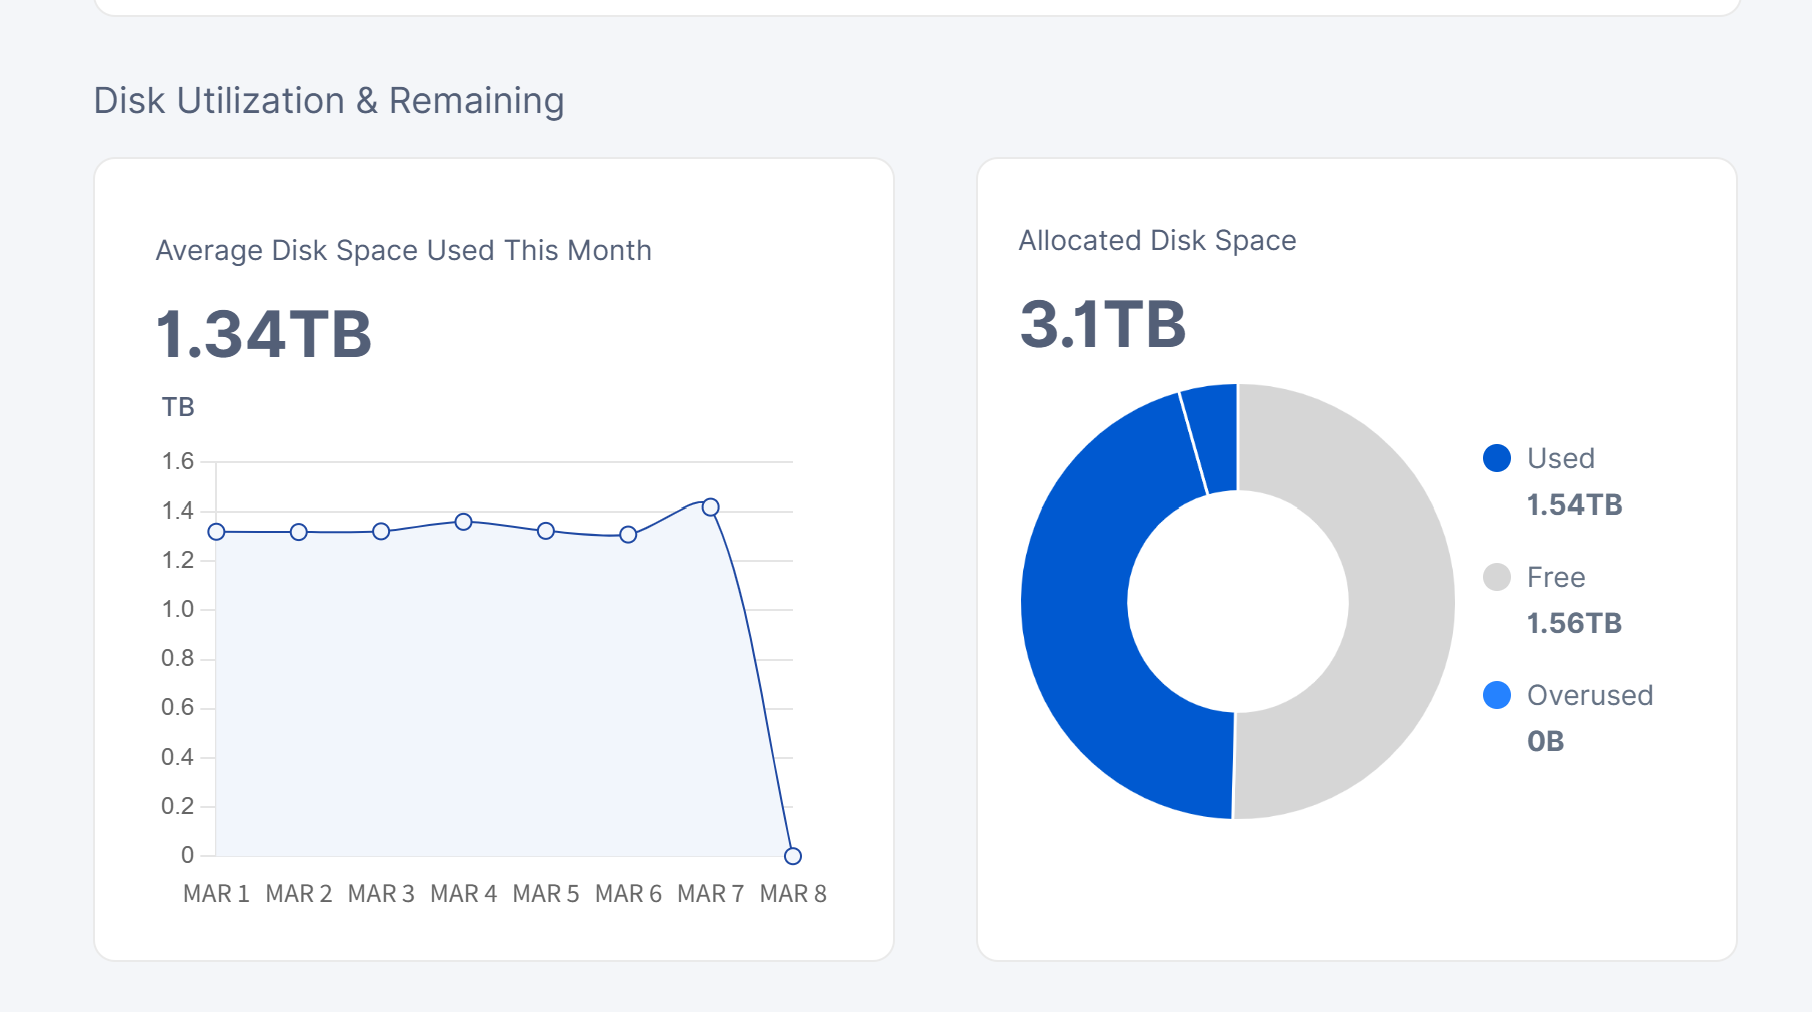
Windows Native Dashboard (Port 14002): Displays the correct total and used storage as expected.
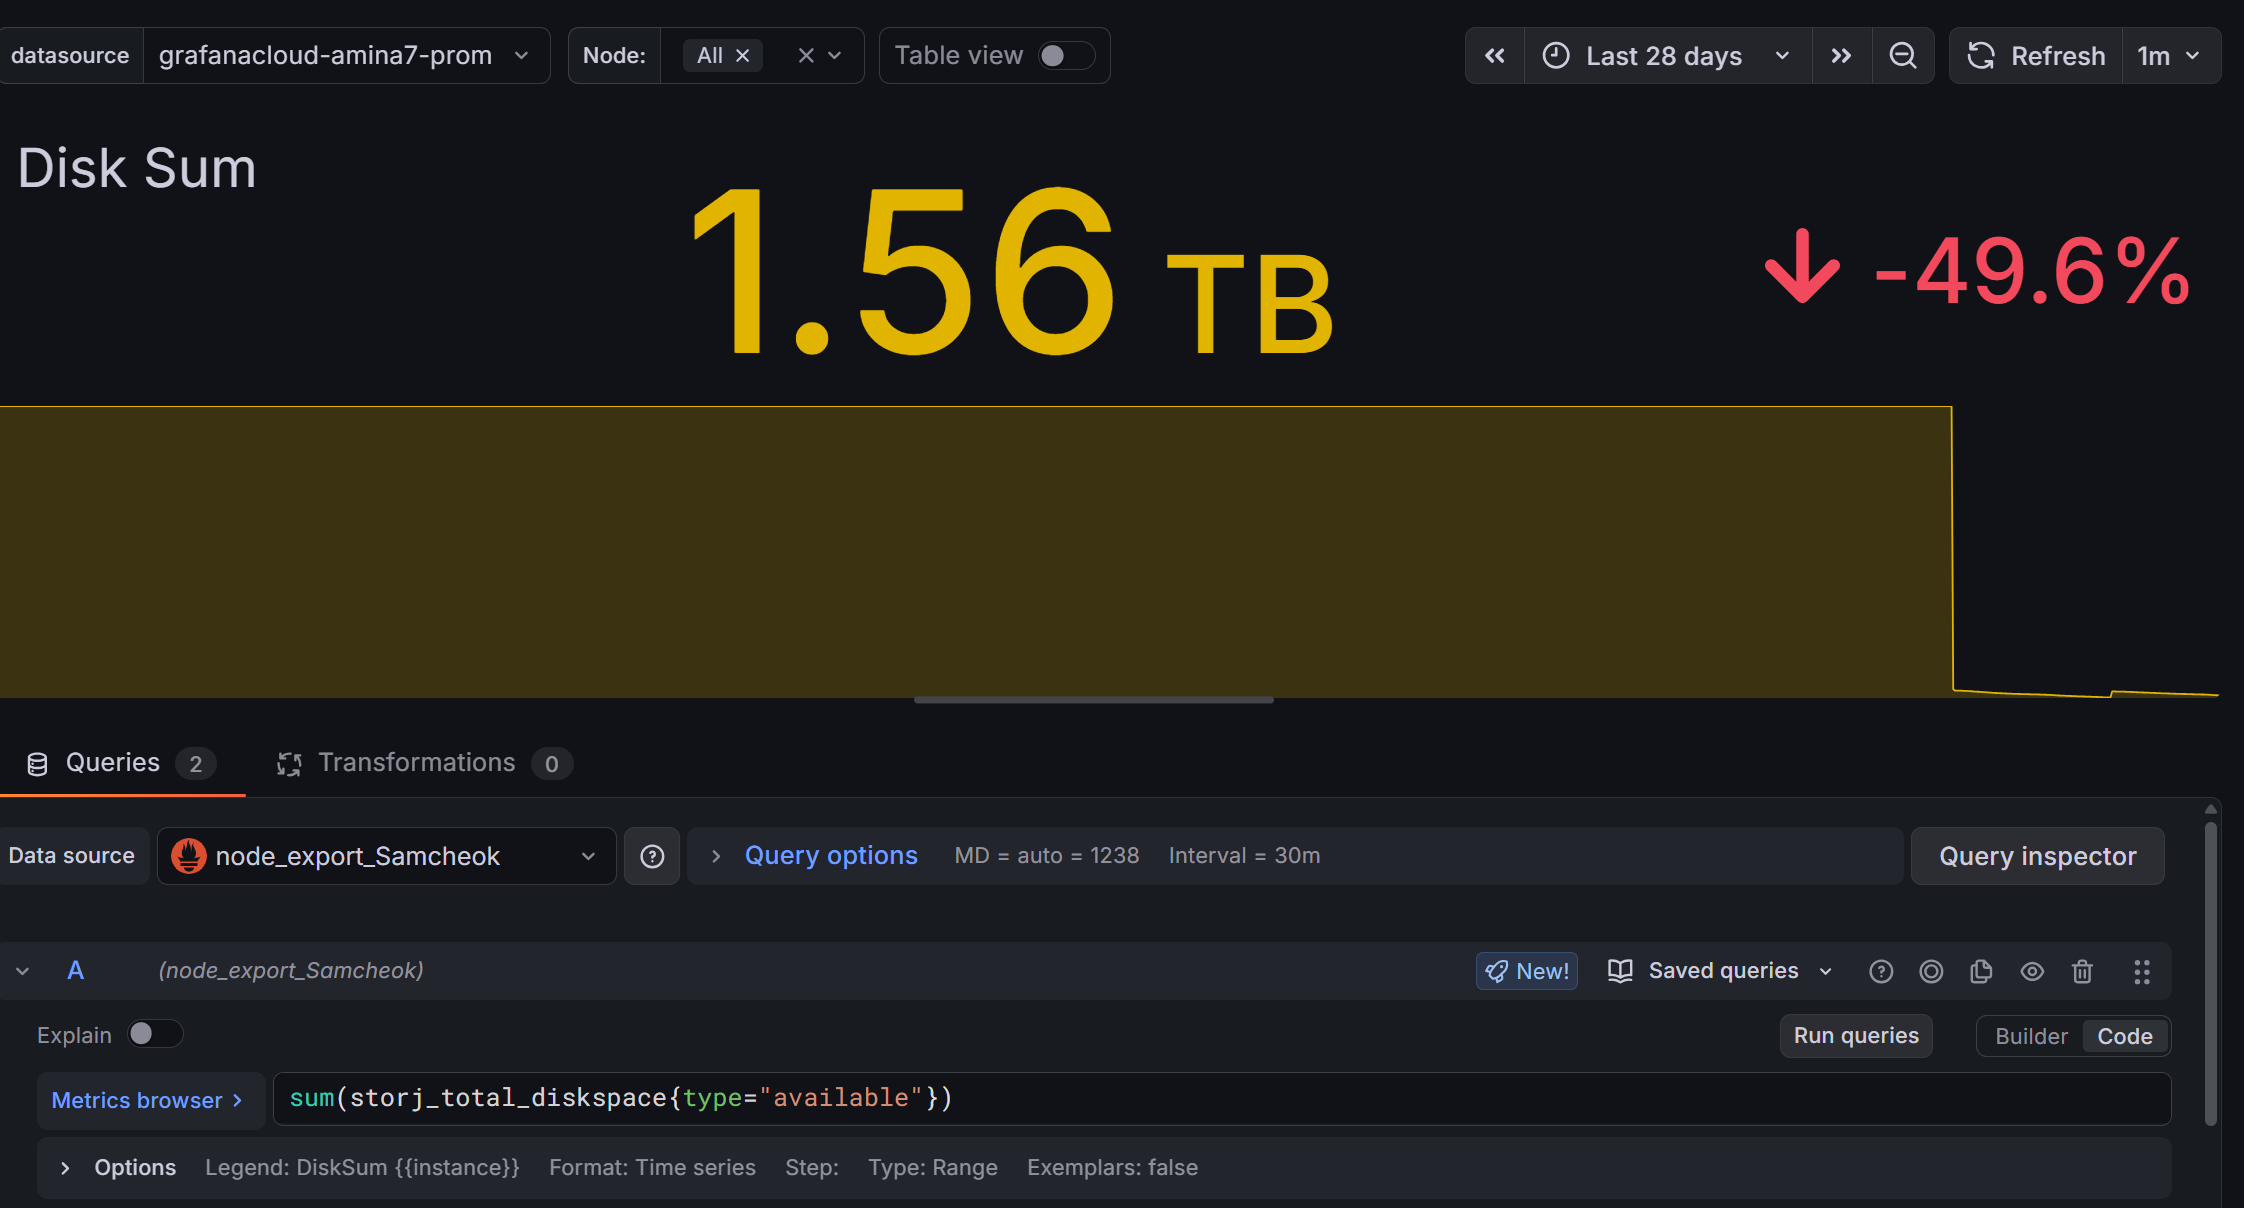
Grafana Dashboard: Shows different (incorrect) values for the total storage compared to what it was before the update.
It was working perfectly fine and showing matching values until the update to 1.148.3. I haven’t changed any configurations on my Prometheus or Grafana setup during the update process.
Is anyone else experiencing this? Do I need to update my storj-exporter or adjust the Prometheus queries for this specific version?
Any help or guidance would be greatly appreciated. Thank you!
Go to http://nodeip:port/api/sno and check values. Then you can understand what values you should use in your dashboard. Used now is a sum of really used, trash and reclaimable.
I just forked from TheChrisTech and added the new data fields: to the storj-exporter container. Image is available on Docker Hub: andreasthesc/storj-exporter
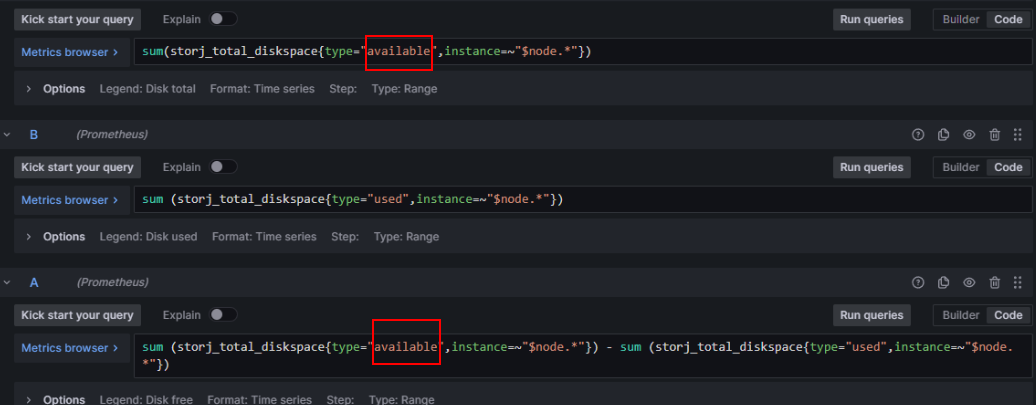
The Grafana Dashboard I will look into maybe tomorrow - mostly you have to exchange “available” with “allocated” Diskspace
Can confirm with the new andreasthesc/storj-exporter that all I had to do was swap in the new “allocated” param in grafana… anywhere it was looking for a “Disk Total” number.
(so I didn’t have to sum (type=~“used|available”) like in Walter1’s example… which showed small rounding/precision errors)
If you’re using storj-exporter, swap to an upgraded fork that understands the changes in the 1.148.x API.
Then in in Grafana you can swap in the new “allocated” variable anywhere you need to specify Disk Total.
For me it was swapping one line in my docker running storj-exporter… no changes in prometheus, and I think changes in two places in my Grafana reports to use ‘allocated’
(Also realized the new 1.148.x node has trash rolled into “used” space now… so it will look like your used went up a bit. The new params could be used to isolate that value to act like it did before (not including trash) but would need more Grafana changes. I’m not worried about it)
Hi everyone, just to make sure I understand the variables correctly:
used = paid data + trash + reclaimable?
available = values as shown by the du command?
overused = everything that exceeds the allocated amount?
allocated = the amount specified in the config that is allowed to be used
trash = deleted files waiting to be permanently deleted after 7 days?
reclaimable = data that hasn’t been released yet due to the hashstore’s mechanics but is still occupying space on the HDD?
Please correct me if I’m misunderstanding any of these values.
Thank you very much