If you have a EU or US salary - it will looks like a free. But Russians get salaries around $400 per month in an average (except Moscow and government). And most of the year they forced to heat their houses to do not freeze. So all relative.
yeah who ever is close by will rob one of their fair share of whatever one has… lol
Only two things are certain, death and taxes… and i’m not sure about the former…

the disk space used this month graph will be changed in the newly release update v 1.9.5
it is current rolled out to windows hosts i believe, but it will take about a week usually before docker and all the others have been rolled out…
it will in v1.9.5 display the same information just over a longer time span using TB*m’onth
aka TBm
The math works like this… in the old version… 1tb stored on disk for 24 hours is equal to 24TB*h
so it adds up quickly… will make much better sense when its on a monthly scale… then 2tb stored for 1 month is equal to 2tb obviously…
i think the reason it calculates this accurately is because that is how accurately the satellites track the data… and so the graph was put on the dashboard displaying this default information…
my node, and yes the graph is all over the place, one of the issues the new graph scale in 1.9.5 will solve

What worries me is that the numbers are inaccurate for some days (VERY inaccurate), and if the calculations for the payouts are based on those numbers then the payouts are not correct.
Looking forward to that update hitting Docker, monthly averages will make a lot more sense.
littleskunk explained why it is like that… apparently the satellites which perform the math, off all the nodes, which ofc takes a while, it completes a cycle in less than a day and then updates the numbers, which are plotted on the graph… but then because its always less than a day tho depending on workload, then it will eventually manage 2 or maybe even 3 updates in a day… while other days it might only do one or maybe even skip one… which is then added in the next day…
its because the data is accurate that the graph is inaccurate ![]()
the avg is correct, the timing it takes to complete is dependent on work load ergo a time factor… and the graph displays numbers over time, and thus the inconsistent time factor makes the graph look inconsistent…
  Keep Calm
     And
Keep Storjing
yeah lots of new goodies in the 1.9.5 update… the successrate issue with the upload / ingress on logs will be fixed also, thus the successrate script will then be rEpporting accurate numbers…
you can see the new changes here…
I detect caffeine deficiency.
i shall immediately remedied that!!! xD
Two minor corrections. The update notes only mention a change in units for the payout overview. Not for the disk space used graph. And the data isn’t inaccurate, it’s just graphed on the day the data is collected rather than the day of it being stored. This means payouts will be exactly what they should be, so nothing to worry about. As for the graph itself, an internal bug report is filed with suggestions on how to fix the fluctuations. Don’t know when that change will be implemented, but it will likely simply show average TB stored throughout each day, which would get rid of the fluctuations.
hmm you are right… maybe i misunderstood something somewhere…
TBm on Payment Dashboard
The storage node payment dashboard will now show used space in TBm instead of TBh. That should be better to read and understand.
or maybe the space used graph and the payout stuff is linked…
i just mistakenly thought it was referring to the graph, because that had been the subject we where talking about a bit earlier… but then again may just be a case of seeing something and thinking it was something else…
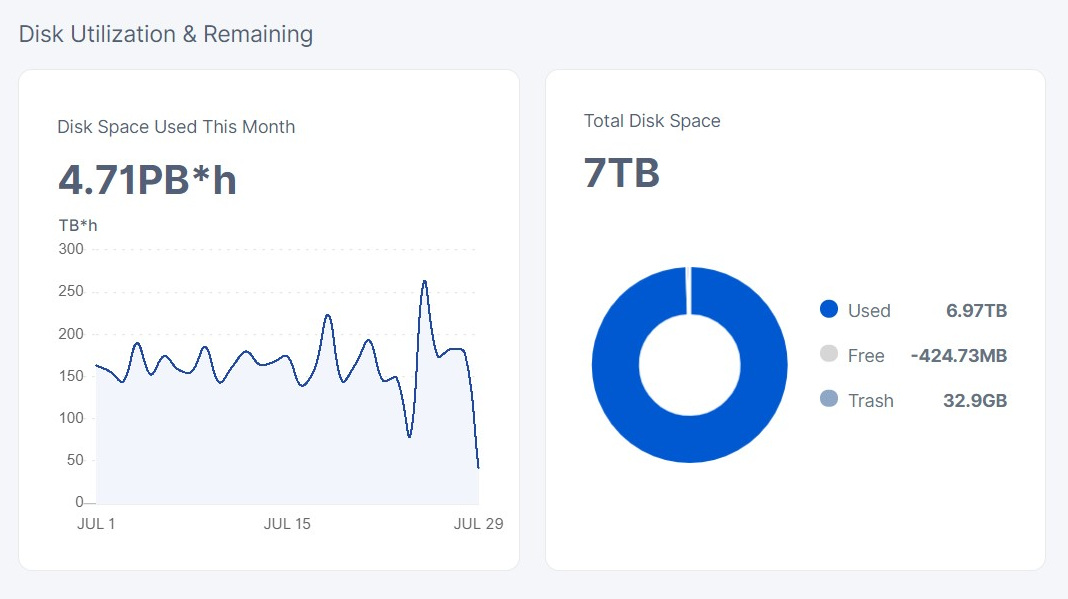


so during 3 days your node deleted 4 tb and then got over 6tb ingress… ![]() on a 7 TB node
on a 7 TB node
sad to see the graph is still ridiculous, even if the number are sort of accurate its just the avg one needs to take…
Yes, if it would use the local information it would be more realistic, but it depends on calculations on satellites’ side. So, if the (Saltlake) satellite did not complete the calculation in time, it looks like this…
Hey ho,
I just started my own 1TB Storj node and I am currently having 170GBH.
I am wondering how the payment works for the storage. Once my 1TB is filled, do I get 1.50$ (1.50 per TB) or do I get payed for the GBH/TB*M or whatever it will be at the end of the month 
Hello @MrProper ,
Welcome to the forum!
The GB*h like a kWh, it’s a measure item for the storage used during amount of time, it’s accounted only when your node is online. At the end of the month the amount of GB*h will be converted to TBm:
720TB*h / 720h = 1 TBm
1 TBm * 1.5 $/TBm = $1.5
But if you have some downtime, your month usage could be lower.
Aha, thanks for your reply! I understand now 