Large unexplained local-vs-satellite storage delta despite compaction

Hi,

I operate multiple storage nodes across multiple independent hosts. The sample is large and diverse enough to make the pattern statistically meaningful.

I am comparing the local live usage reported by the node with the per-satellite at-rest accounting:

local live bytes = diskSpace.used - diskSpace.trash - diskSpace.reclaimable

The satellite side comes directly from /api/sno/satellite/<satellite-id>. For comparisons I only use a completed UTC day that is available for all satellites and has a plausible intervalInHours value (greater than 0 and no more than 168). Trash and hashstore reclaimable bytes are therefore already excluded from the local value.

From the data it looks like there are two separate problems, and the recent accounting issue alone does not explain the whole delta.

1. Broken/missing at-rest intervals caused a sudden additional jump

Across essentially all measured nodes in the sample, on multiple hosts, US1 currently returns the same malformed rows in the raw SNO API:

UTC date intervalInHours atRestTotalBytes
2026-07-20 11 normal value
2026-07-21 -17,755,584 0
2026-07-22 0 0

This is not introduced by my monitoring code; these values are present in the node’s own SNO API. The synchronized dates across independent hosts also make a single database, disk, or host problem very unlikely.

The nodes are not blocking the satellites. Current PUTs, GETs, repair traffic and audits are arriving, and audit/suspension scores are healthy. The same nodes communicate with all satellites normally.

There were isolated malformed or missing intervals in earlier months as well, often on the same dates across nodes. May was clean in the representative histories I checked; June already had a cluster, and July has become much more frequent. This looks related to the problem discussed here:

In my monitoring, some individual nodes moved from roughly the previous 15-20% delta range toward about 70% within roughly two days. The normal node-to-node median increase was much smaller, so the extreme values are not representative of every node, but the timing strongly correlates with the malformed intervalInHours rows and the missing newer common accounting day.

2. A large delta already existed before July 21

The malformed July 21/22 rows cannot explain the whole problem. Before July 21, local live usage was already increasing while satellite at-rest accounting did not follow it sufficiently, and many nodes already showed a persistent delta around 15-20% or higher.

The latest host-level medians in the sample are approximately:

Storage layout Median local-live minus satellite-at-rest gap
Mixed piecestore + hashstore about 18-23%
Pure hashstore about 14-22%

So this is not limited to nodes that still use both piecestore and hashstore. Fully migrated hashstore nodes show the same underlying pattern, although the distribution differs by host and node.

Why compaction does not seem to explain it

Hashstore compaction is active. The configured thresholds are 0.60 or 0.75, and the current maximum compaction lag in the measured set is about two days. On some nearly full nodes compaction demonstrably released real filesystem space (for example, nodes with only a few GB free gained around 100 GB and then began filling again). So compaction itself is doing real work locally.

Nevertheless, the satellite-vs-local-live delta remained large. The currently distributed bloom filters are old (roughly 22-30 days), and there were no new filter updates during the last seven days. I understand that stale bloom filters can leave recently deleted pieces locally until a newer filter arrives. However, the size and historical baseline of the observed delta appear much larger than what the age of the latest bloom filter alone would explain, especially because:

  • trash and reclaimable data are excluded from the local value;
  • compaction has run recently;
  • the issue also exists on pure hashstore nodes;
  • the baseline delta was already around 15-20% before the malformed July 21/22 accounting rows;
  • and recent local live usage continued to grow while the newest valid satellite at-rest day stayed behind.

Questions

  1. Are the negative/zero US1 intervals on July 21/22, plus the earlier synchronized missing days, a known current satellite tally problem?
  2. Will those missing daily rows be backfilled or corrected in the SNO API, so the at-rest history catches up automatically?
  3. Can these missing intervals affect the final monthly storage payout, or only the dashboard/history display?
  4. What is the expected difference between local live bytes (used minus trash/reclaimable) and satellite at-rest bytes on a healthy node?
  5. What can explain a persistent 15-20%+ baseline gap on pure hashstore nodes after compaction, apart from pending deletions covered by future bloom filters?
  6. Is a 22-30 day-old bloom filter currently expected, and can the satellite estimate how much unreferenced data should normally accumulate during that period?
  7. Is there any safe operator action, or should operators simply wait for corrected tally data and newer bloom filters?

I can provide per-day/per-satellite raw API extracts and distributions if that would help. The sample spans multiple nodes, disks and independent hosts, so the pattern is not based on one anomalous node.
Below is an anonymized evidence extract. The letters are temporary sample labels only. Node IDs, node names, hostnames, IP addresses, ports, filesystem paths, piece IDs and the total size of the monitored population have been removed.

All individually displayed samples belong to the same operator account and were selected from multiple independent hosts. To prevent matching them back to public node statistics, capacity values have been proportionally perturbed and rounded by more than just a few bytes. The following mathematical relationships were preserved exactly:

local_live = used - trash - reclaimable
gap        = local_live - satellite_at_rest
gap_%      = gap / local_live * 100

Dates, intervalInHours, zero/non-zero status and the reported anomaly pattern are not modified. Activity counts are also slightly perturbed and rounded, while action totals remain internally consistent. Aggregate mixed-versus-pure-hashstore ranges do not contain individually identifiable node rows.

1. Structure-preserving SNO API extract

Endpoint used on each node:

GET /api/sno/satellite/<US1-satellite-id>

The structure and interval values below come from the storageDaily array returned by the node itself, not from my monitoring application’s calculations. Only the non-zero byte value was proportionally perturbed and rounded.

Mixed piecestore/hashstore sample A:

[
  {
    "intervalStart": "2026-07-20T00:00:00Z",
    "intervalInHours": 11,
    "atRestTotalBytes": 2164500000000
  },
  {
    "intervalStart": "2026-07-21T00:00:00Z",
    "intervalInHours": -17755584,
    "atRestTotalBytes": 0
  },
  {
    "intervalStart": "2026-07-22T00:00:00Z",
    "intervalInHours": 0,
    "atRestTotalBytes": 0
  }
]

The relevant interval fields were identical in every selected sample:

Sample Layout Jul 20 hours Jul 21 hours Jul 22 hours Jul 21/22 bytes
A mixed 11 -17,755,584 0 0 / 0
B mixed 11 -17,755,584 0 0 / 0
C mixed 11 -17,755,584 0 0 / 0

2. Local-live versus satellite-at-rest snapshots

Formula:

local_live_bytes = used_bytes - trash_bytes - reclaimable_bytes
gap_bytes        = local_live_bytes - satellite_at_rest_bytes

All displayed values below are anonymized bytes rounded to 100,000,000-byte units. The satellite date is the newest completed UTC day for which all satellites on that node had a plausible interval. Invalid zero/negative rows were not substituted as zero-byte storage.

Local byte calculation:

Sample Layout Used Trash Reclaimable Local live
A mixed 3,787,700,000,000 0 149,600,000,000 3,638,100,000,000
B mixed 4,003,900,000,000 0 20,100,000,000 3,983,800,000,000
C mixed 4,026,700,000,000 0 38,800,000,000 3,987,900,000,000

Comparison with satellite at-rest:

Sample Satellite at rest Common UTC day Gap Gap %
A 3,168,100,000,000 2026-07-20 470,000,000,000 12.92%
B 3,095,000,000,000 2026-07-20 888,800,000,000 22.31%
C 3,560,000,000,000 2026-07-20 427,900,000,000 10.73%

The malformed July 21/22 US1 rows explain why the newest common day is stale, but they do not explain the pre-existing baseline.

The broader, non-identifying distribution still shows the same issue on fully migrated hashstore nodes:

Storage layout Rounded host-level median gap range
Mixed piecestore + hashstore approximately 18-23%
Pure hashstore approximately 14-22%

Individual pure-hashstore rows are intentionally omitted here. The aggregate range is included only to show that the baseline is not exclusive to mixed layouts.

I also separated the estimated on-disk format overhead from the remaining gap:

estimated format overhead: less than 0.15% of local live bytes
remaining payload gap: approximately 12-19% of local live bytes

Across the anonymous host-level aggregates, format overhead accounts for less than 1% of the observed gap. In other words, the approximately 17% baseline cannot be explained merely by hashstore record/container overhead. Almost all of it remains classified as a payload gap after trash, reclaimable bytes and estimated format overhead are removed.

3. Current satellite communication

To exclude a connectivity or firewall issue, I parsed a fresh 15-minute Docker-log window from three representative samples. Only event types and satellite names were retained; piece IDs, addresses and ports were discarded. Counts below are deliberately rounded and slightly perturbed, but the row totals remain consistent.

Window ending approximately 2026-07-23 13:13 UTC:

Sample GET PUT GET_REPAIR PUT_REPAIR GET_AUDIT Total parsed events
A 3,700 780 280 70 50 4,880
B 2,650 740 230 80 50 3,750
C 4,300 1,550 290 110 40 6,290

All four production satellites were present in the same window:

Sample AP1 EU1 Saltlake US1
A 75 1,200 5 3,600
B 70 630 10 3,040
C 95 1,090 5 5,100

Rounded score summary across the selected samples:

minimum online score: above 0.92
minimum audit score: above 0.9999
minimum suspension score: 1.0

This is why I do not think the zero/negative at-rest rows are caused by the satellites being blocked. US1 was actively sending normal GET, PUT, repair and audit traffic while its daily at-rest API rows were invalid.

4. Compaction and bloom-filter context

At the time of this extract:

configured compaction thresholds: 0.60 or 0.75
maximum observed hashstore compaction lag: about 2 days
new bloom-filter updates during previous 7 days: none
current bloom-filter age: roughly 22-30 days

Compaction demonstrably released real filesystem space on some nearly full nodes, but the local-live versus satellite-at-rest gap remained. Because reclaimable bytes are already subtracted, the question is what accounts for the remaining persistent baseline on pure hashstore nodes and whether an old bloom filter can realistically explain that full amount.

5. Storage payout is also below expectation

There is a separate recent report with a very similar high-level symptom:

Massive Estimated Payout Drop?

That operator reports an approximately 15% estimated payout reduction across multiple nodes while average used disk space is growing. Replies currently speculate about missing bloom filters/trash or the recent US1 issue, but there is no confirmed explanation in that thread yet.

My storage-only payout projection is likewise materially below what the measured capacity would suggest. This comparison excludes egress, repair and audit income. At the same time, both the node dashboards and actual disk utilization show approximately 10% more used storage than in the preceding comparison month.

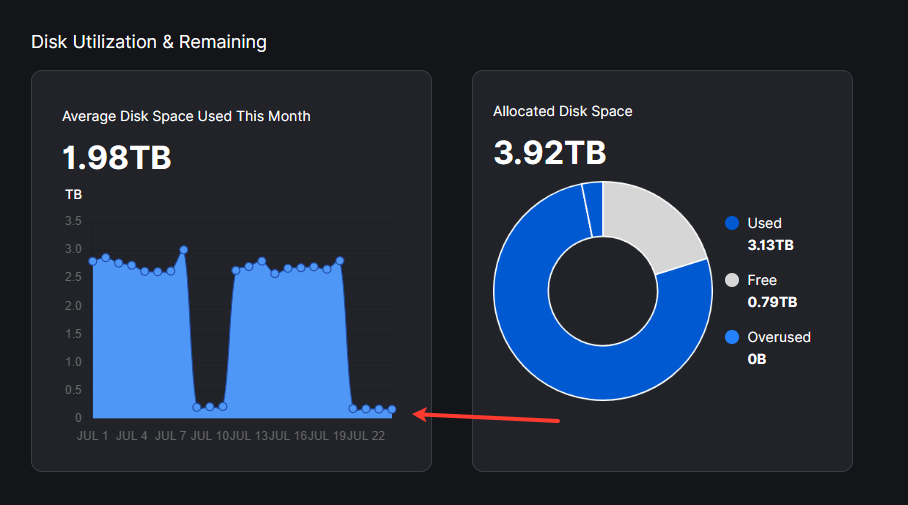
This discrepancy was already clearly visible before July 21, so the current negative/zero US1 rows cannot be its only cause. Earlier irregular or missing days around July 4, 6 and 9 appeared to be caught up later, but the storage payout expectation still remained below the level suggested by the increased local usage.

This also does not appear to be explained by trash or already known reclaimable data:

trash: remains close to zero and is not materially accumulating
hashstore reclaimable: explicitly subtracted from local live bytes
estimated format overhead: separately measured and less than 0.15% of local live

Therefore, simply saying that the additional disk usage is “trash caused by old bloom filters” does not yet reconcile the numbers shown by the node APIs. If the unexplained payload is waiting for a future bloom filter, it is not currently visible as trash or reclaimable. If it is still valid payload, the question is why it is missing from satellite at-rest accounting and from the expected storage payout.

6. What would help to clarify this

The questions I am trying to separate are:

  1. Why are the same negative/zero intervalInHours rows present across independent nodes and hosts, and will those daily records be repaired or backfilled?
  2. Independently of those malformed days, what exactly does the pre-existing approximately 17% payload gap represent?
  3. Are these locally present payload bytes still valid pieces that the satellites expect, but which are currently missing from satellite at-rest accounting?
  4. If they are valid but absent from at-rest accounting, are they currently excluded from storage payout, or will the satellite reconcile and pay for them later?
  5. Alternatively, are they pieces that the satellites no longer expect and which are therefore effectively local garbage? If so, which mechanism is supposed to identify and remove them?
  6. If that second explanation is correct, why are those bytes not already represented as trash or hashstore reclaimable data? Are they waiting for a future retain/bloom-filter update and subsequent compaction, or is there another cleanup state/mechanism involved?
  7. Can Storj provide the expected normal ranges separately for:
    • filesystem/hashstore format overhead,
    • payload awaiting a newer bloom filter,
    • payload already marked reclaimable,
    • and genuinely satellite-accounted live payload?
  8. Does storageDaily.atRestTotalBytes directly drive monthly storage payout, and how are missing or malformed daily intervals reconciled before payout is finalized?
  9. Why is the storage-only payout expectation below the level implied by approximately 10% more locally used capacity, even though this shortfall was already visible before July 21 and earlier missing days appeared to be caught up?
  10. If the answer is pending garbage collection, where can an operator observe those bytes before they become trash or hashstore reclaimable data?

This distinction matters operationally: if the approximately 17% consists of still-valid pieces missing from satellite accounting, it may represent stored data that is temporarily not visible or not paid. If it consists of pieces the satellite has forgotten or deleted, it represents real disk space that should eventually become reclaimable. At present the node-side APIs do not make that distinction clear.

If useful, I can also provide additional anonymized storageDaily ranges around earlier synchronized missing days. I would prefer to first know which exact fields or date range would be most useful to Storj engineering.

As this may help, here are additional anonymized storageDaily ranges around earlier synchronized accounting failures.

The individually checked samples are the same operator-account samples A, B and C from independent hosts. Node IDs, hostnames, paths and exact byte totals are omitted. Dates, satellite names, intervalInHours, zero/non-zero status and the synchronization pattern are unchanged.

Historical synchronized invalid rows

The following invalid rows were present in the local storage_usage.db histories of all three selected samples:

UTC date    Satellite   A hours       B hours       C hours       at_rest_total
2026-03-06  Saltlake    -17,752,320   -17,752,320   -17,752,320   0
2026-04-14  EU1         -17,753,256   -17,753,256   -17,753,256   0
2026-06-19  Saltlake    -17,754,840   -17,754,840   -17,754,840   0
2026-06-20  Saltlake    -17,754,864   -17,754,864   -17,754,864   0
2026-06-21  Saltlake    -17,754,888   -17,754,888   -17,754,888   0
2026-06-22  Saltlake    -17,754,912   -17,754,912   -17,754,912   0

May contained no corresponding invalid/zero interval in these representative histories.

The first subsequent valid row contained non-zero and unusually elevated accumulated byte-hours. With exact byte totals anonymized, the approximate relationship to the preceding nearby valid row was:

  • March 6 → first valid row March 7: about 1.7× the nearby valid byte-hours
  • April 14 → first valid row April 15: about 1.6×
  • June 19-22 → first valid row June 23: about 8.5×

This makes it look as if byte-hours may be accumulated into a later row even though the daily interval presentation is broken. I cannot determine from the node-side data whether that later total fully reconciles the missing storage payout.

July sequences from the direct SNO API

The current-month SNO API exposes an even clearer negative/positive pattern. These interval values were identical on samples A, B and C:

  • July 4-5, EU1: -17755198, 17755224 → displayed sum: 26 hours; atRestTotal: zero, then non-zero
  • July 6-7, EU1: -17755224, 17755275 → displayed sum: 51 hours; atRestTotal: zero, then non-zero
  • July 9-11, US1: -17755302, 0, 17755382 → displayed sum: 80 hours; atRestTotal: zero, zero, then non-zero
  • July 21-22, US1: -17755584, 0 → still invalid; atRestTotal: zero, zero

The first three sequences are notable because the huge negative and positive values arithmetically cancel to finite, day-scale totals of 26, 51 and 80 hours instead of millions of hours. This does not prove that every missing hour was restored. The positive row also contains the non-zero accumulated atRestTotal.

The July 21-22 sequence has not yet received such a positive recovery row in the checked API output.

Questions raised by this pattern

  1. Is this negative/positive pairing an expected representation of a delayed tally, or a bug in intervalInHours calculation/serialization?
  2. Does payout accounting sum the raw atRestTotal byte-hours, allowing the later positive row to compensate for the missing days?
  3. Or does any part of the payout calculation depend on the malformed interval or the derived atRestTotalBytes, which can become zero or nonsensical for these rows?
  4. Did the March, April, June and earlier July recovery rows fully backfill the missing payable storage, and is there an operator-visible way to verify that?
  5. Should a similar recovery row be expected for the currently open July 21-22 US1 sequence?
  6. Even if the delayed rows are later reconciled for payout, what explains the separate, persistent local-live versus satellite-at-rest payload gap that was already visible before July 21?

The recurring synchronization across independent hosts and nodes is why this does not look like an individual node database or disk problem.

Sorry I don’t have the time right now to read everything in detail. I might find time for that later. For now I can give a short explaination.

  1. We migrated the DB to TiDB. For a few days tally was not running. It looks like there is a gap again since July 20th. I will forward that to the team.
  2. We have automated the pending deletion cleanup. So there was a cleanup happening but it should be barely noticeable.
  3. Outdated bloom filters is not great. That is going to slowly creep up the amount of garbage left behind. I will forward that to the team as well.
  4. For hashstore there are some debug calls that would allow you to check how much garbage hasn’t been compacted yet.

We have seen these for a long time now:

Thanks both — that helps separate the issues.

@littleskunk, the TiDB/tally interruption would explain the synchronized malformed rows and the current gap since July 20. Thank you for forwarding that and the outdated bloom filters to the team.

@jammerdan, agreed: the negative intervalInHours pattern itself is not new. I included the historical examples mainly to show that it occurs synchronously across independent nodes and to distinguish it from the separate, pre-existing local-vs-satellite payload gap.

Two questions remain important:

  1. When tally catches up, are the missing byte-hours fully backfilled for the final storage payout, regardless of the malformed intervalInHours values shown by the SNO API?
  2. Could you please share the exact hashstore debug calls you mentioned, and how their output should be interpreted?

Ideally, I would like to distinguish per satellite/store between:

  • dead data already known to hashstore but not yet compacted,
  • data not yet identified as garbage because the retain/bloom filter is outdated,
  • and payload currently considered live.

That would let me reconcile those values with diskSpace.reclaimable and determine how much of the persistent roughly 15–20% gap is unclassified local garbage versus satellite-accounted live data.

I will also monitor whether the open July 21/22 and now also 23 sequence receives a later positive recovery row and report the result here.

The avg usage is not used to calculate a payout, but sent orders - are.
The avg can have nulls and they are not backfilled by storagenode (the PR is welcome) and likely will not be backfilled on the satellite, because they are not essential and used only to display the rough estimation of the satellite’s point of view and to present a payout estimation, which usually not matches the actual usage and payout calculated on real numbers from sent orders, not averages.

This hurts my eyes. Will this ever be completed?

I’ve completed and made PR. linux executable with 2 fixes here - Release v1.160.21 · Aleksman4o/storj · GitHub