Good luck with your exams. By then I should have an auto-build working so it can be downloaded from docker hub (where currently only amd64 is available).
@kevink, I’ve been playing with Grafana Loki and changing the log.enconding: json in the storagenode config.yml. It may be possible to grab metrics that way without a ton of regex work. I’ll let you know if I come up with anything substantial. Loki is not nearly as robust/featureful as Prometheus for dashboard queries, so I’d still be interested in exporting metrics to Prometheus to feed your dashboard.
I managed to get the multi-arch auto-build working. The image can now be downloded from docker-hub kevinkk525/storj-log-exporter:latest and doesn’t need to be built locally. I updated the How-To in the first post.
I got the dashboard running again however I did build it locally, I tried to use the updated command to download it from docker hub but it gave the following:
root@odroid:~# sudo docker run -d --restart unless-stopped --user "1000:1000" \
>     -p 9144:9144 \
>     --mount type=bind,source="/mnt/StorjHDD",destination=/app/logs \
>     --name storj-log-exporter \
>     kevink525/storj-log-exporter:latest -config /app/config.yml

Unable to find image 'kevink525/storj-log-exporter:latest' locally
docker: Error response from daemon: pull access denied for kevink525/storj-log-exporter, repository does not exist or may require 'docker login': denied: requested access to the resource is denied.
See 'docker run --help'.
huh that is weird… what platform are you running on? do other downloads work? I tested it even on a remote RPI and it downloaded just fine.
My node is on an odroid HC2, the node was running so I suppose that downloads work.
Just retried now and it seems to work, no idea why if failed earlier…
Time for an update:
You need to update the log-exporter container!
because with the last update storjlabs added a “size” attribute to all upload messages and I only added it to the upload_successful.. So you are missing information at the moment.
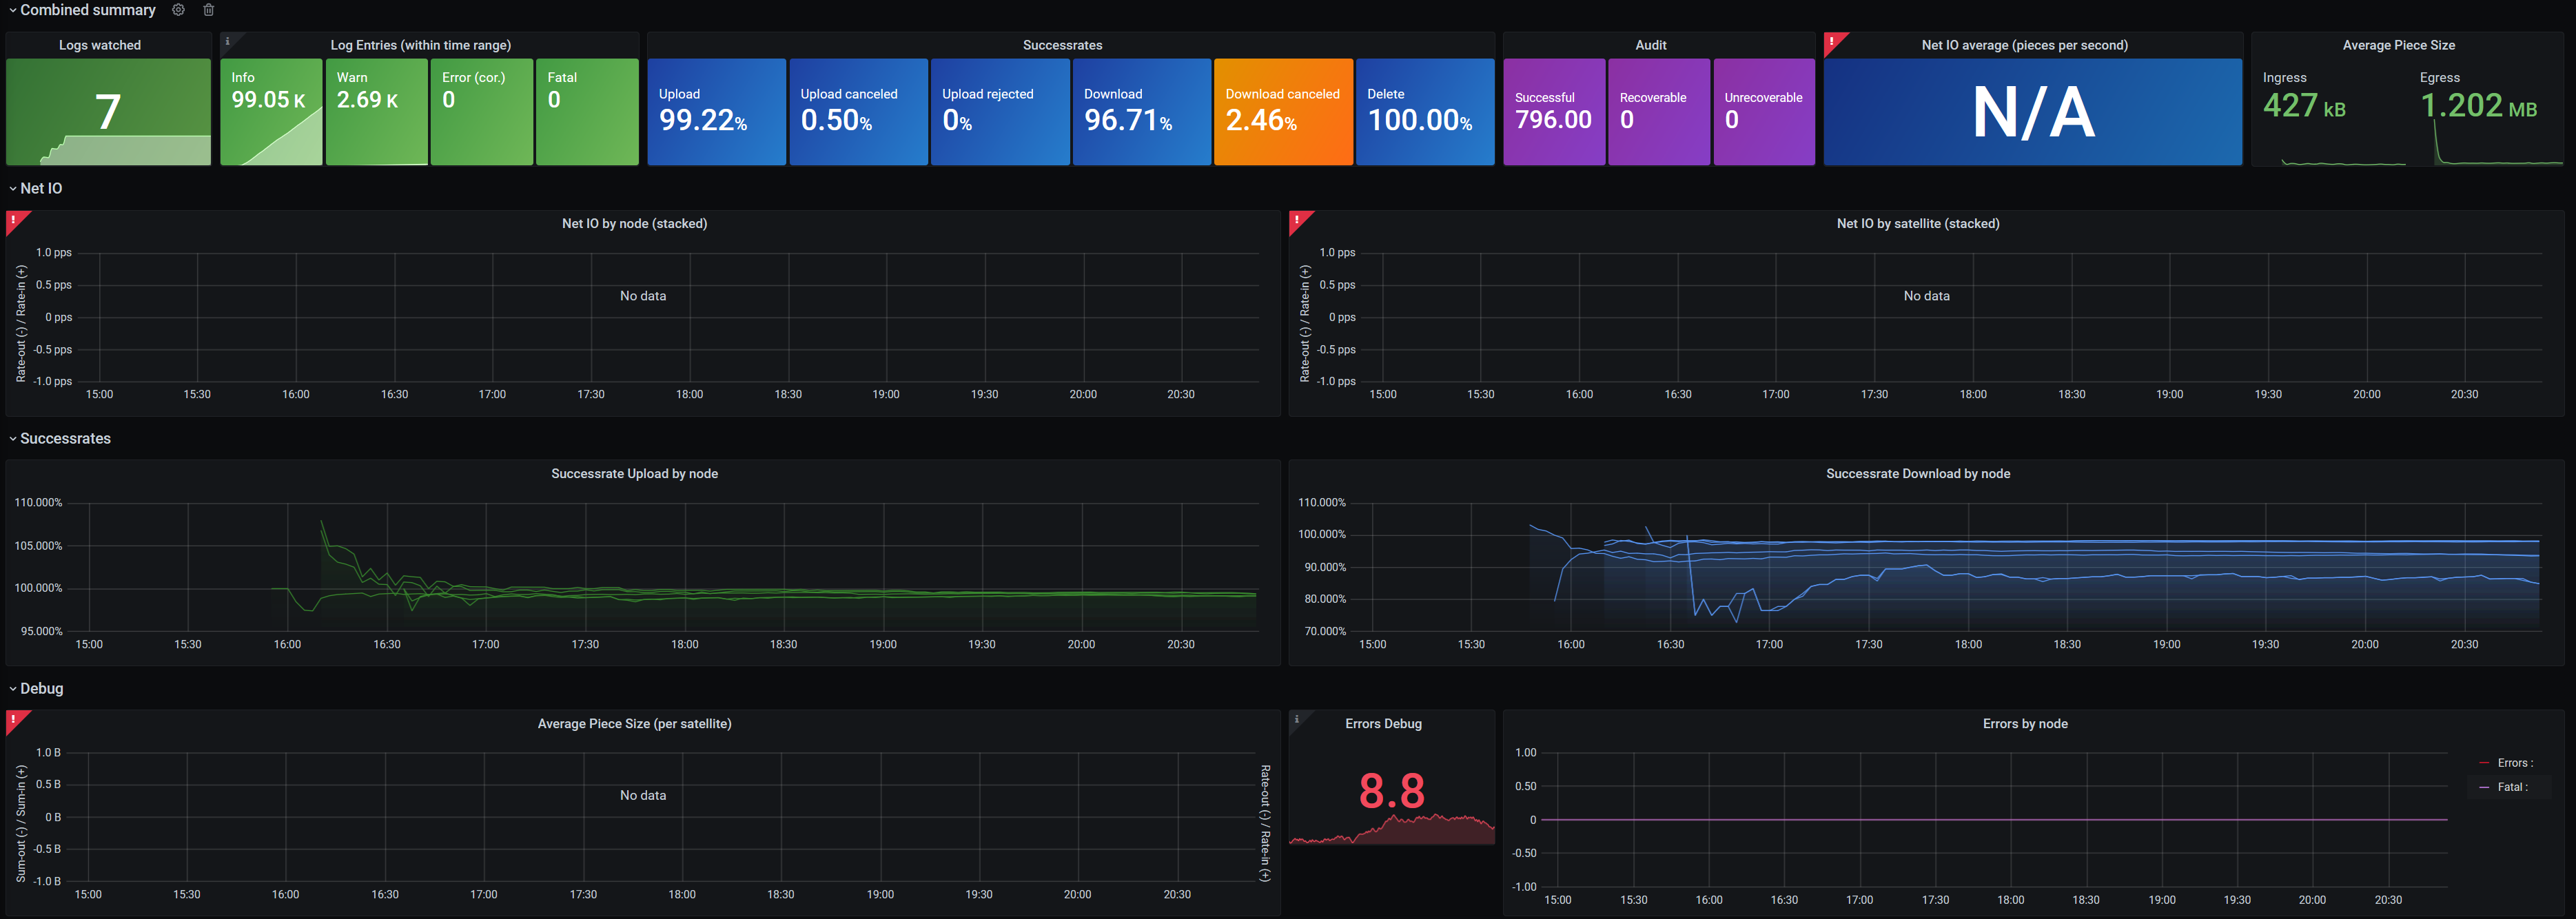
New Dashboard
I created a new dashboard that also needs the storj-exporter from @greener Prometheus Storj-Exporter and can be found in his dashboard repository as well as mine. You can download it from here: https://raw.githubusercontent.com/kevinkk525/storj-log-exporter/main/dashboard_log_exporter.json
The new dashboard has many metrics and many options. Choose what you want to see. You can (un)hide the sections you want to see. Coloring has been standardized, ingress/upload is green, egress/download is blue, storage(io) is purple-ish. Also egress is always shown negative in graphs and ingress positive (netdata does it the same way, the old exporter from @greener does it the other way around, so don’t be surprised).
Sections:
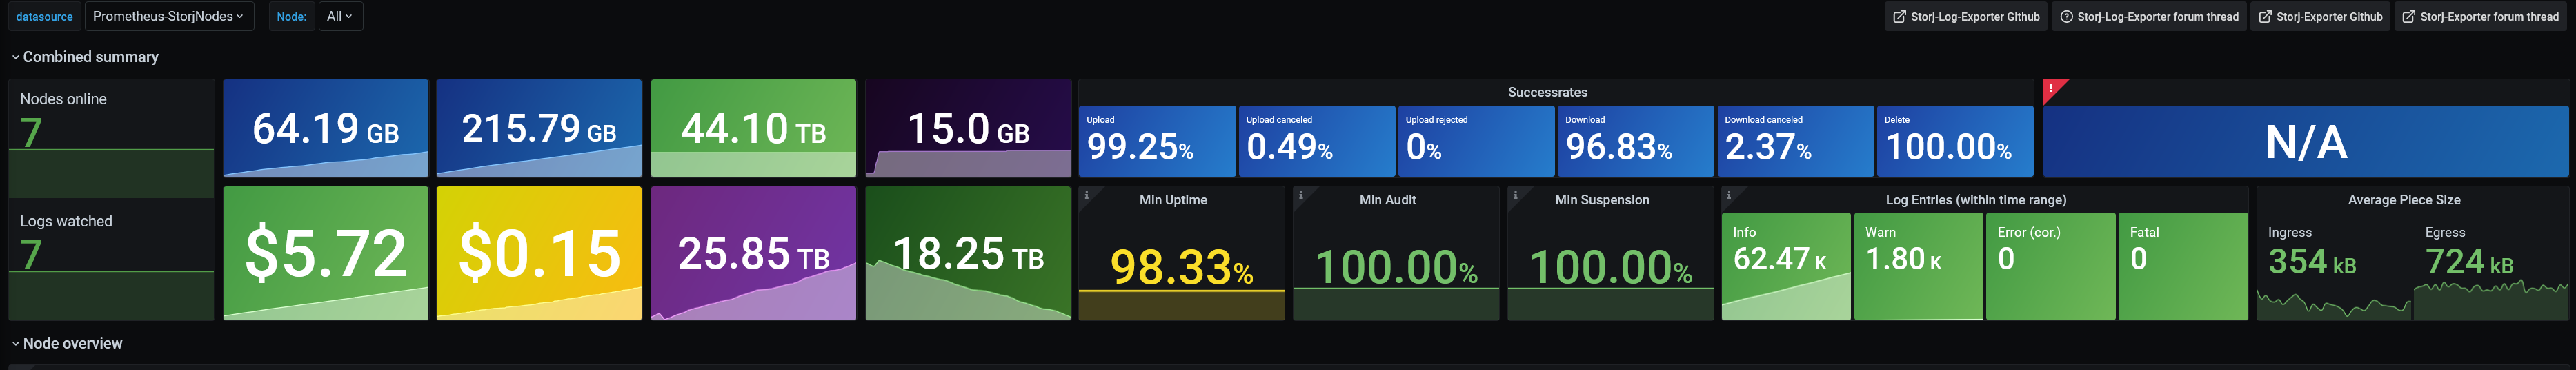
- Combined Summary with all important information. If you only look at these, you won’t miss anything important. It will warn you about (among other things) new error messages or the minimum uptime/audit/suspension score of any node on any satellite, so you can quickly see if one node is having a problem.
- Node overview showing all nodes in a boomtable with the most important information. Get a quick overlook over all nodes and possible problems (audit score dropping etc).
- Different form of NetIO graphs: Simple (maybe you like it because it has less colors), By node (multiple colors, very distinct node overview), by satellite (so you can finally see where all that traffic comes from or which satellite deletes lots of data)
- Successrates
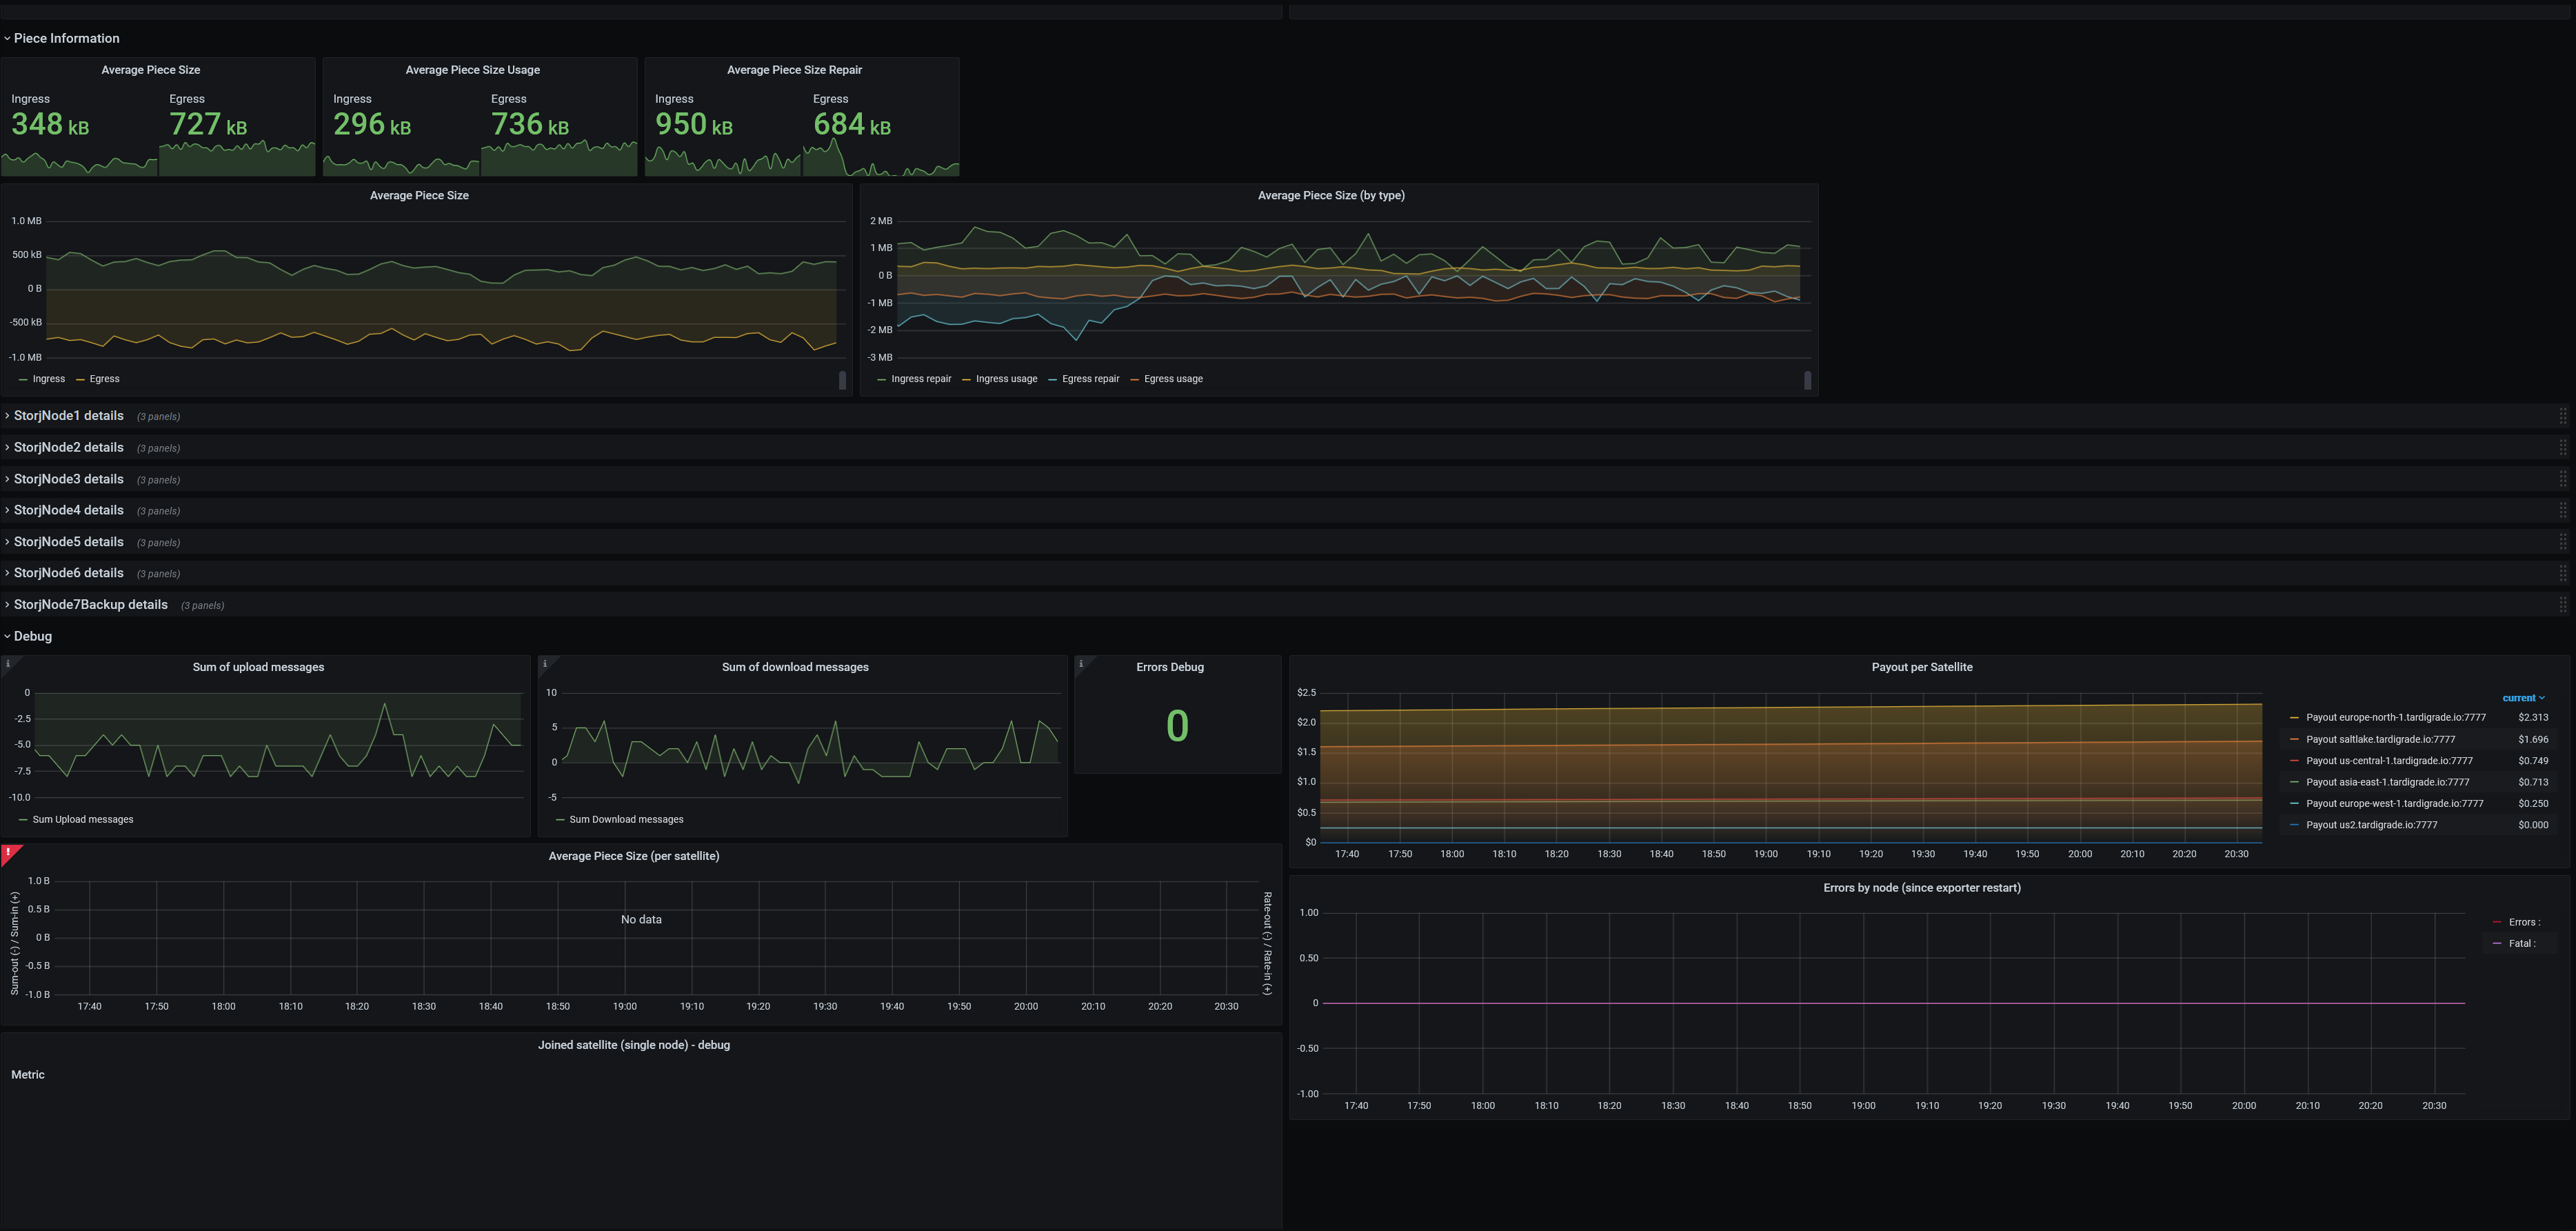
- Piece information (see what average pieces size you get/send, repair and usage difference)
- Detailed stats from each node
See pictures in the first post, or better: Just try it ![]()

Hey @kevink, wouldn’t this be the correct link ?
https://raw.githubusercontent.com/kevinkk525/storj-log-exporter/main/dashboard_exporter_combined.json
Anyway it looks awesome !
Yes that is the correct link to the new dashboard.
Great! Runs wonderfully and immediately saves a lot of time. Thank you for the work
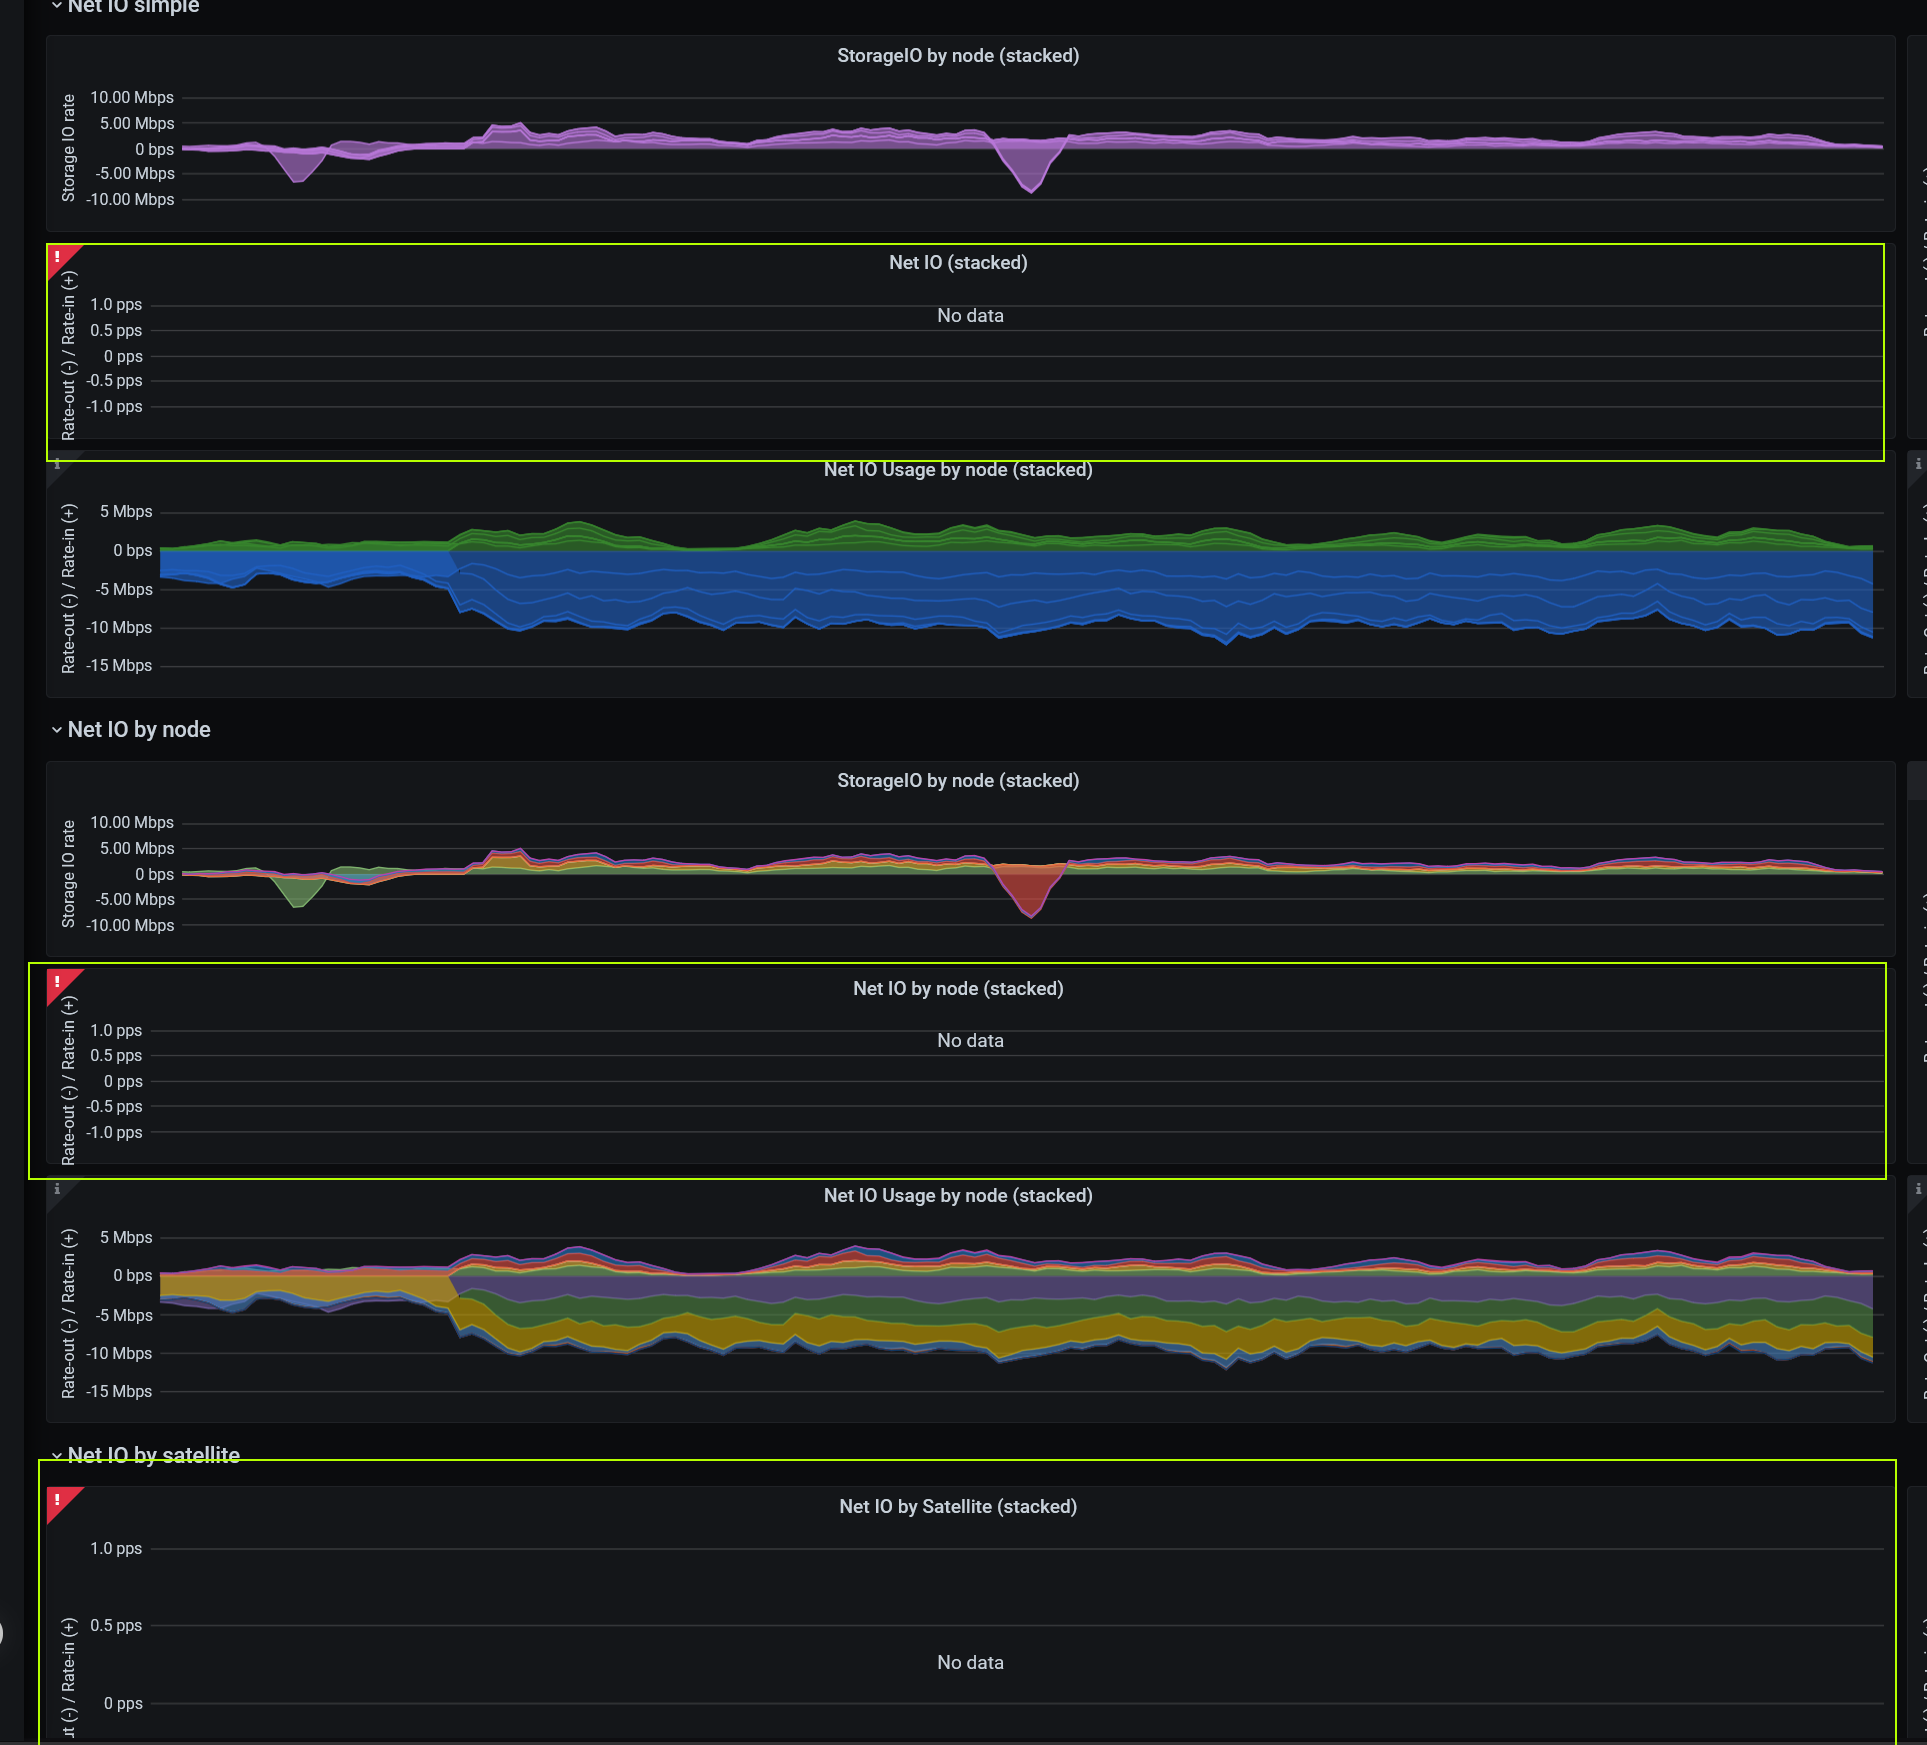
So you’re getting data for the successrates but not for the NetIO? What does the log entries panel show? and the debug panel please and the successrates graph.
Did it ever work or just happen now?
Strange…
Why is it not showing labels in the last picture (e.g. for Earnings month)? Did you change that?
Honesly, I’m buffled… I mean all those broken graphs actually use the same data as the successrates in the last picture, so I’m not sure why it doesn’t work.
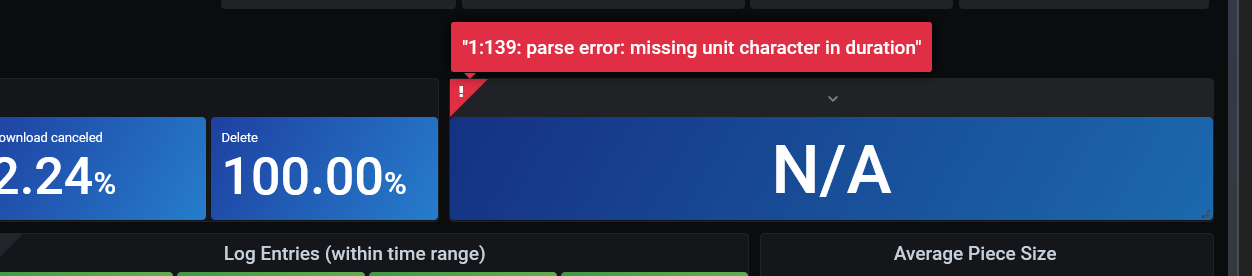
I have no idea what your error message means: “1:139: parse error: missing unit character in duration”
![]() Glad we solved that one.
Glad we solved that one.
Can you send me the output of your errors in your logs (only the errors, not the whole log)? The debug value indicates that my log-exporter misses some error categorizations. It’s nothing serious as the error count up top is not relying on it but I’d still like to get it right.
Sure, should I send you all errors per node or combined?
Combined is fine, I just have to check why my rules don’t match all your errors. So all unique errors are interesting but not per node.
@kevink, I’ve taken a spin on your Grok Prometheus exporter and implemented it in Grafana Loki and Promtail, ultimately resulting in the same dashboard as this, but populated from Promtail metrics instead of storj-log-exporter.
From the repo, here’s the motivation:
I’ve been interested in exploring Grafana Loki with Promtail for log ingestion and metrics for a number of different services on my home server. Testing it out for Storj nodes seemed like a great way to get an understanding of how it works.
For Storj nodes, the main benefit is that a single Promtail listener can injest logs from multiple nodes and produce metrics that Prometheus can then scrape. Individual storj-log-exporter instances are not required.
Furthermore, once the logs are ultimately shipped to Loki, one can do LogQL queries against them in Grafana or using LogCLI. For example, to search for all
ERRORlog level entries:

The repo includes instructions for installing the Loki Docker driver and a docker-compose stack for Storj, Storj-Exporter, Loki, Promtail, Prometheus, and Grafana and builds heavily on the existing work that has been done by you and @greener.
One of the main caveats is that to reduce regex work, I opted to use the JSON formatted log output from the storagenode service. This makes the logs look different from the familiar console output, but it’s much easier to parse for generating metrics and from my cursory checks, doesn’t appear to trip up apps like successrate.sh.
Just throwing this out there in the wild in case anyone else is interested in a Loki/Promtail proof-of-concept. Thanks for all the hard work on this!