For a while now I have been ingesting my Storj docker logs into Graylog for longer term retention and analysis and figured that there are probably some other SNOs who can benefit from a Storj specific configuration guide. I am sure I will have missed stuff, so if I have, please let me know. I will try to assist with issues where possible. Keep in mind that Graylog can use a decent amount of RAM and storage space over time, which can be reduced by reducing the number of logs being retained, which will be covered at the end.
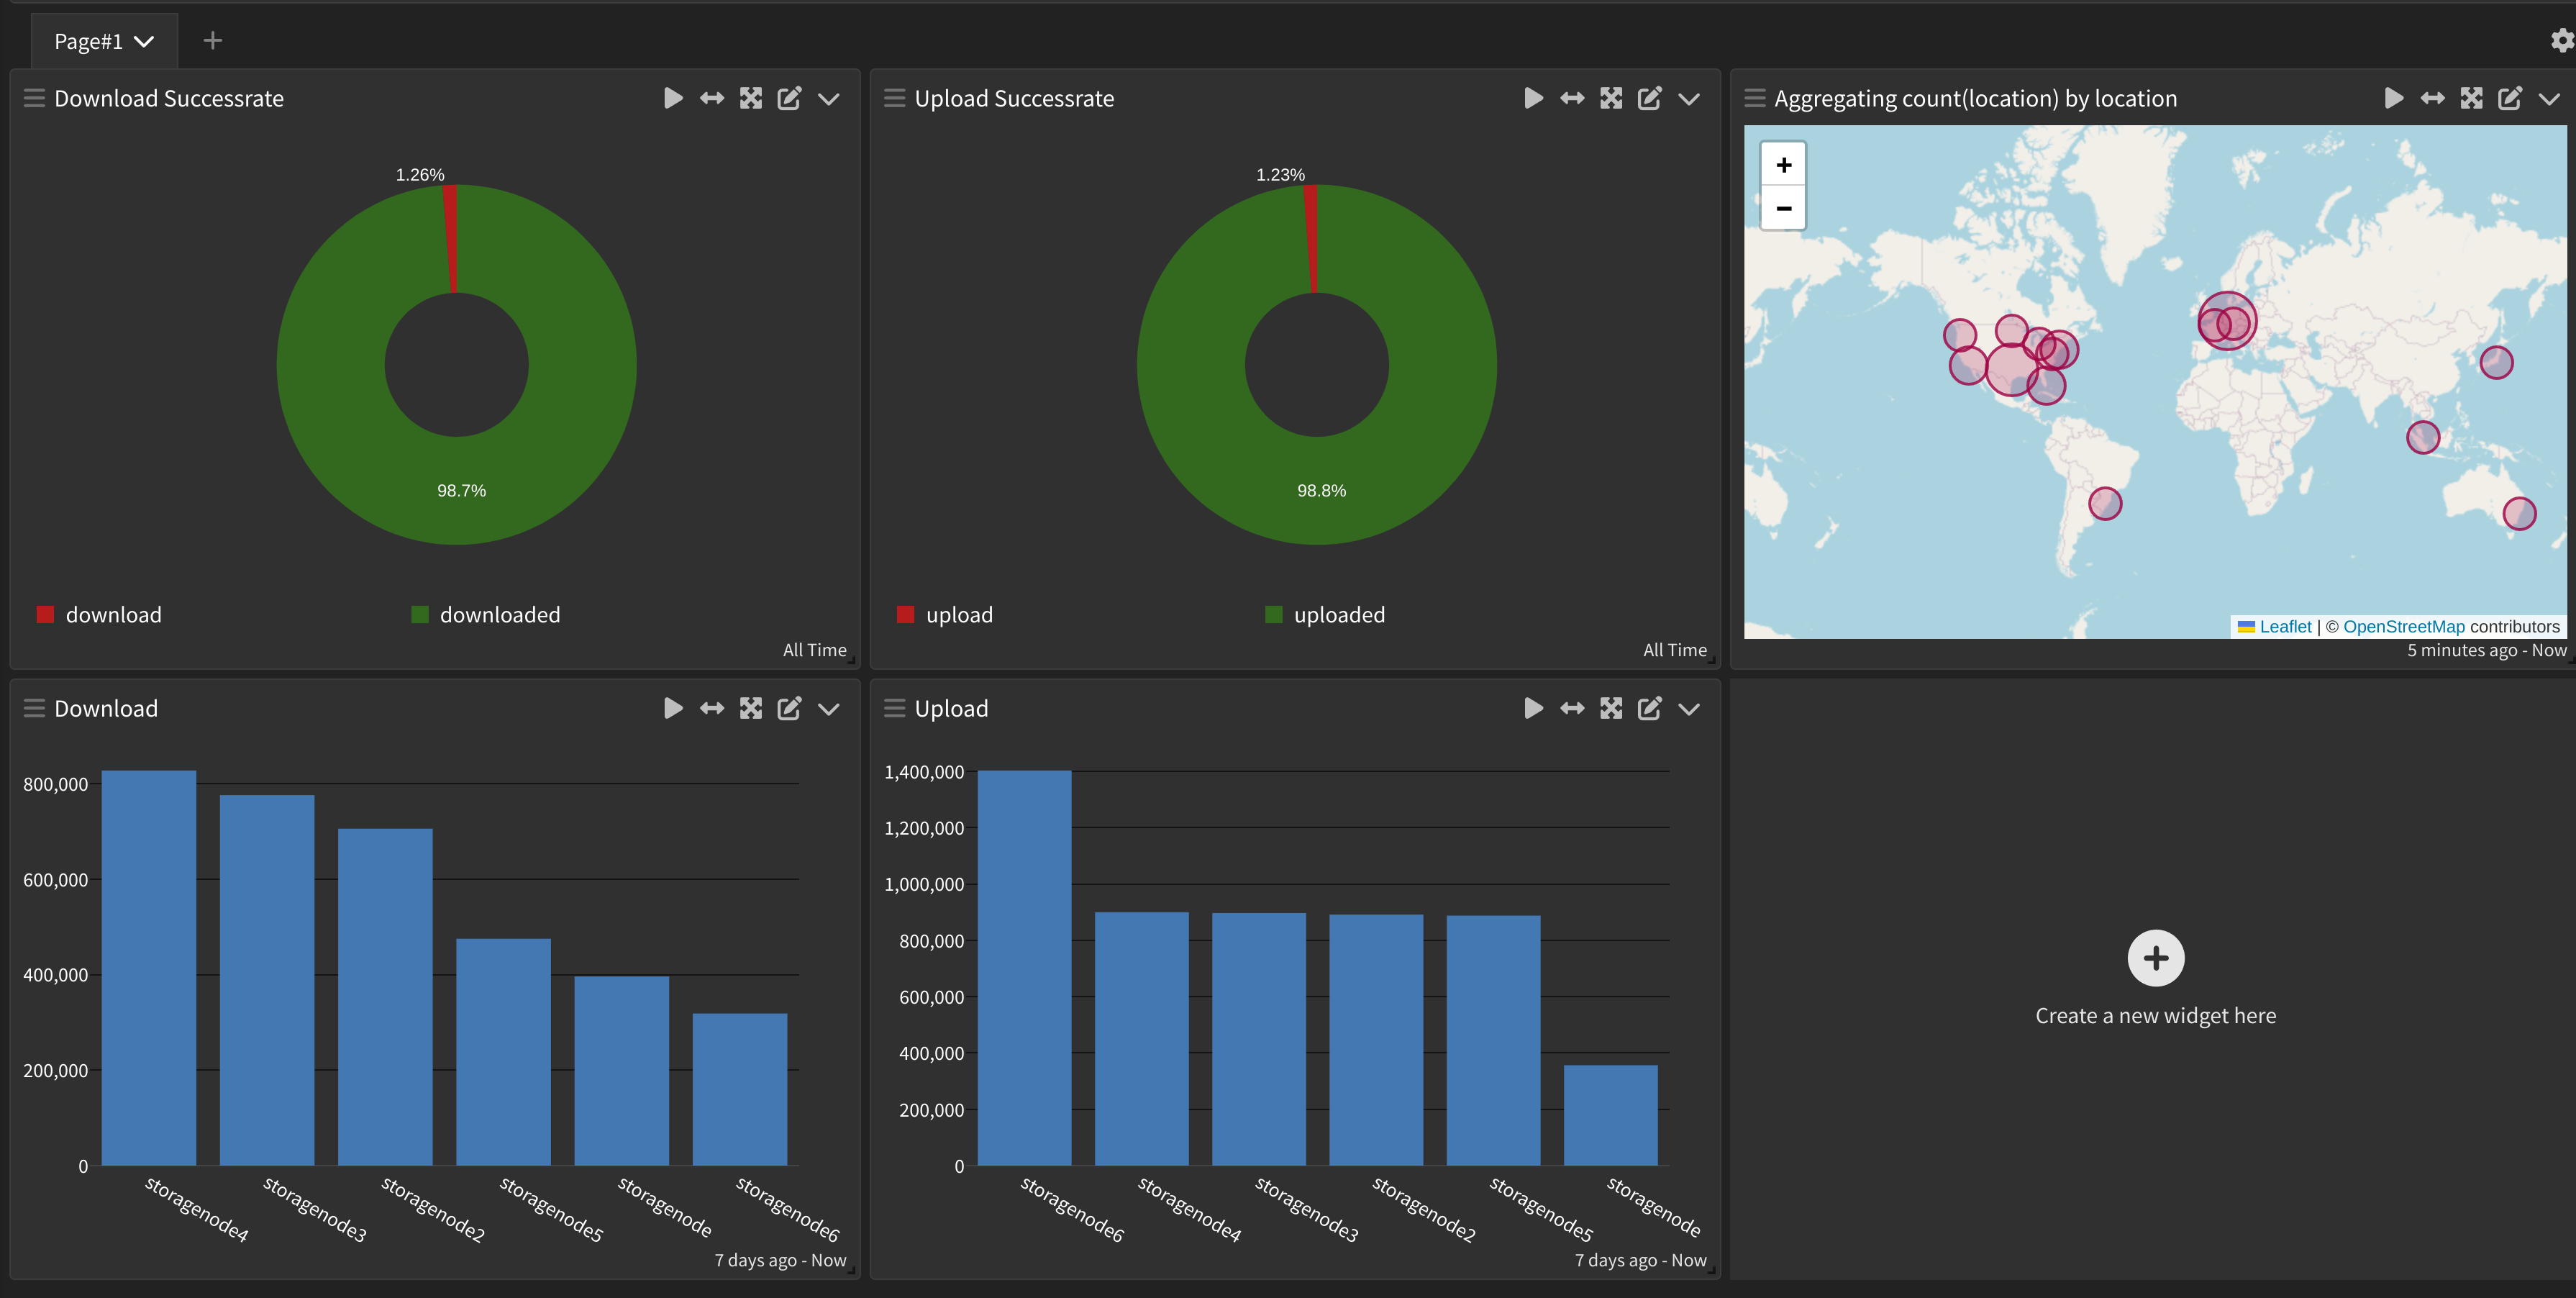
Example of the end result:

NOTE: This stops the logs from being stored in the container so scripts like audit_success and successrate will no longer work as they are run against the logs stored on Docker. There are lots of analysis and visualization capabilities in Graylog, some of which I will cover in this initial post and update as I build out more to replicate as much as possible from the community scripts.
This guide assumes that you already have a working Graylog installation. You do not need to be ingesting data before proceeding with this though, this guide will cover setting up log ingestion. Setting up Graylog is pretty straightforward, the guides for doing so can be found here. There are definite improvements that can be made to this guide, it is essentially just the barebones to get SNOs going for analyzing their Storj logs. I encourage anyone implementing this to play around with the application as there is a lot of functionality to be leveraged with it.
After having logged into the Graylog web interface, we first need to set up a data input.

In the “Select input” field, search for and select “GELF UDP” and clink “Launch new input”

In the newly opened window, open the “Select Node” dropdown menu and select the Graylog server. Enter a title in the Title box. All other default settings should be sufficient for this data input. Once filled out select “Save” from the bottom. There should now be a GELF UDP input in the Input screen. Click “Start input” on the right side if the input is not running.

Next we will need to set up extractors. By default the logs ingested by Graylog will not be breaking the ingested data down into fields that can be indexed, so any analysis will be done against the entire log message string from each log entry which is slower and makes visualizations such as graphs not possible for comparing multiple types of messages. Click “Manage extractors” for the newly created input.

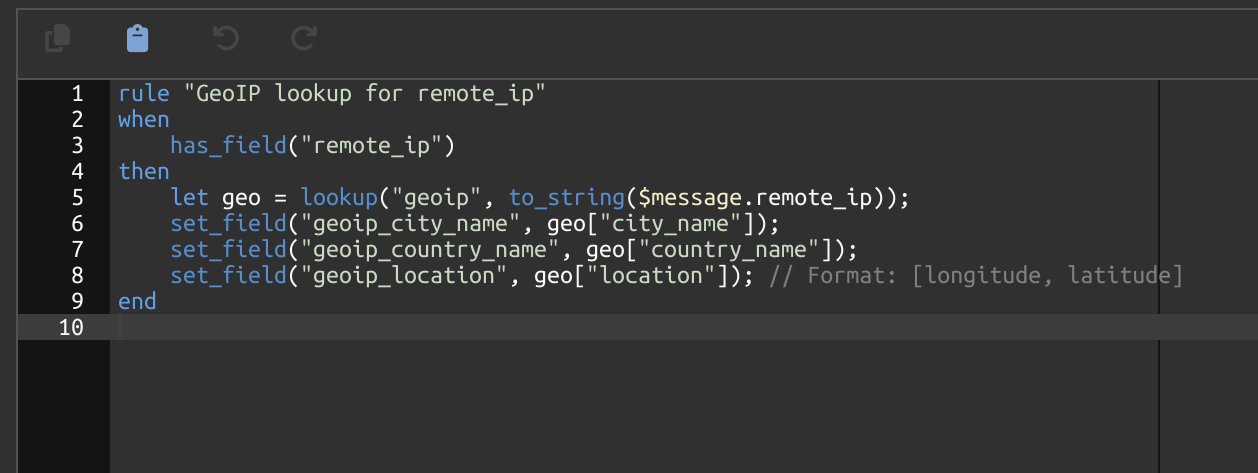
I have already gone through the trouble of building extractors for this work. Also thanks to initial work @Alexey (and @storjio68943 from the old Rocket Chat) did for his Logstash implementation. I updated the GROK queries for Graylog and the latest version of storagenode software. This covers the majority of types of log messages that Storj will generate, but please let me know if there are any additions you would like to see. From the Extractors page, select “Import extractors” and copy/paste all of the below text to import the JSON for all of the Extractors and then click “Add extractors to input” on the bottom left


With the extractors in place to start indexing incoming data, that should be all that is required for Graylog to start ingesting your logs. Next, your docker run command will have to be updated to redirect your logs to the Graylog server. The docker run command will require two additional flags:
–log-driver gelf
–log-opt gelf-address=udp://1.2.3.4:12201
The first line is telling Docker to use the GELF driver to output the logs in GELF format which includes some extra information about the host and container which is useful for filtering in Graylog. The second flag will have to be updated to be the IP address of the Graylog server (replace 1.2.3.4 with the IP of the Graylog server, change the port if you did not use the default port in the input configuration). In order to apply this the storage node container will have to be stopped and removed then run again with the additional arguments.
At this time you can verify that Graylog is ingesting data by going to “Inputs” and looking at the “Throughput/Metrics” section on the right.

At this time you can also start running searches by clicking on “Search” on the top left of the web page. Now that Graylog is ingesting logs, you can start working with the data being ingested. Keep in mind that this will only contain the logs since starting the docker container pointing it to Graylog. But any subsequent restarts of the container for updates or any other reason the container would stop will not result in log loss like it would before without redirecting to a separate file or another log source.
To start visualizing and quantifying the data beyond searching for logs, go to “Dashboards” via the top bar in the web page and click “Create new dashboard”

To create a widget for monitoring upload success/cancelled rates, use the following example.
On the left side, click the “+” icon or the arrow near the top of the left side to expand in order to create a widget. For this we will use the “Message Count” Predefined Aggregation. With the newly opened window, use the time dropdown to change from “Search in the last 5 minutes” to “Search in all messages” or whatever other timeframe you would like to observe the results from. Use the search query as below in the Search field, replacing $source_name with the the hostname of the system running the storagenode container:
source:$source_name AND Function:("uploaded"|"upload canceled")
Select “Visualization Type” → “Pie Chart”
Select “Rows” → “Function”
It should now show something similar to this:

Click Save at the bottom and now you have yourself the beginnings of a dashboard to monitor your upload success and cancelled rates in real time. To enable constant dashboard updates as new logs are ingested, click the “Not updating” dropdown menu in the top right side and select the frequency for updating the dashboard.

Don’t forget to click Save as well to save your dashboard whenever any changes are made.
In the default Graylog/Elasticsearch index set, 20M logs will be kept for each index and rotated 20 times before deleting data. This results in a setting of 400M log entries that Graylog will store. This can be reduced by going to “System” → “Indices” → “Default index set” and “Edit” on the left side.

In the newly opened window, at the bottom, change the “Max documents per index” in order to change how many lines of logs are kept in each index and change the “Max number of indices” to change how many indices (files) are kept. Multiplying these two together will tell you how many lines of logs will be stored before deletion occurs. Click “Save” once the settings have been updated to your preference.
There is a lot more that I am hoping to expand this by over time and hopefully be able to keep the extractors up to date if future storagenode updates change the logging format. Graylog will continue ingesting data even if the extractors stop matching incoming logs, but for some of the visualizations they will be impacted until the data is being indexed with updated extractors again.
Please let me know if you were successful in getting this set up as well as any improvements that can be made to this guide. Also as an ask to Storj staff if future updates change the logging format, that would be appreciated to know in the release notes so that extractors can be updated beforehand to keep indexing working properly as soon as a node is updated.