Now it hit me: 'Your node has been suspended'

Lol.
Just saw it: Your node has been suspended on 1wFTAgs9DP5RSnCqKV1eLf6N9wtk4EAtmN5DpSxcs8EjT69tGE.

Now what shall I check first?

The disk was a bit in heavy use since yesterday evening. I guess resulting from that I see numerous failed to add bandwidth usage messsages.

What I did so far:

docker logs storagenode 2>&1 | grep -E 'GET_AUDIT' | grep 'failed' | wc -l
0
docker logs storagenode 2>&1 | grep -E 'GET_REPAIR' | grep 'failed' | wc -l
16

Log start date is on 2/2/22 so sufficient time has passed for the log to be meaningful.

Could it be that 16 failed GET_REPAIRS cause a suspension? What else could I check?

Edit: Here is a weird thing: The dashboard shows the nodes online time as: 4h 0m.

did you have any sort of issues and is the node still suspended on that satellite…

its not to difficult to offend the suspension score but that usually recovers very quickly…
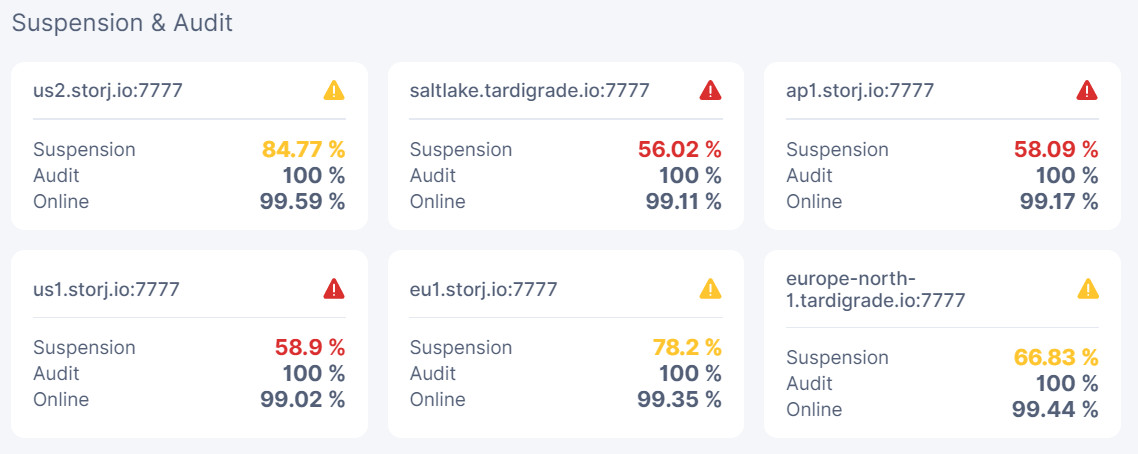
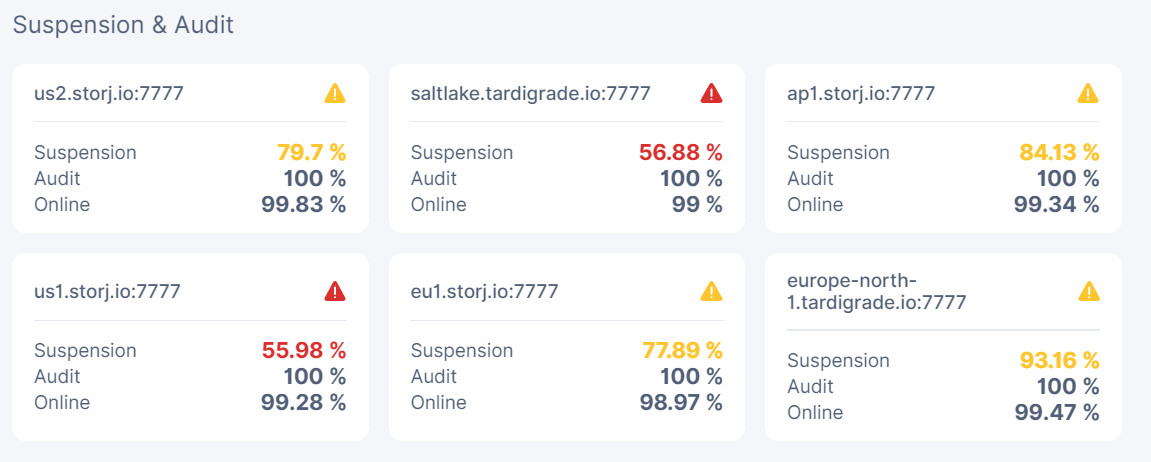
had my system stall out a few days ago and got a few suspensions, but when i noticed and checked it a few days later it was all fine again.

No, no issues, just the heavy disk usage. I am looking aat the logs and the node is running just fine.

Are you kidding me?

outofsuspension

5 minutes ago suspension score was at like below 50%.

1 Like

If you have a huge node already, it’s going up fast, yes. :v:t2:

yeah it surprise me to, apparently there are two stages or kinds of suspensions… one can be really short and is cause by a lot of intermittent issues in a short time, and the score will jump right back.

the other is the one we are more familiar with and usually lasts a lot longer.

don’t really know the exacts of it… i think it was @Alexey that was taking about it at one point.

Yes it could, I would look at what the errors say.

Big node, big satellite. The score can change very quickly with that combination.

It is getting really weird now:

docker logs storagenode 2>&1 | grep -E 'GET_REPAIR' | grep 'failed' | grep '1wFTAgs9DP5RSnCqKV1eLf6N9wtk4EAtmN5DpSxcs8EjT69tGE' | wc -l
0

So the errors have not been with the saltlake satellite on which the node got suspended. How is that possible?

That is weird, but regardless you should look at them. Unlike normal transfers, repairs shouldn’t do long tail cancellation, so you shouldn’t see errors for those at all.

Indeed.
Is there something else other than failed I could grep for?

You could look for ERROR, but I think you would get the same lines. It’s possible they get stuck somehow and just never finish.

I’ve experienced a similar thing with my latest suspension - huge traffic, directly linked linked to auditing and repairs. Node hang up - suspended. It took 3 days to recover and allow new ingress.

Yes. Nothing meaningful. It must have been stuck resp. offline somehow.

That was a good one: Up only 7 hours for this node. Which of course is not what it should be as I have not restarted it for days. So something must have gone seriously wrong.

Ah yes, this one is good too: dmesg: read kernel buffer failed: Operation not permitted
This is probably it.

20.10.7. I am on Debian but it seems I have pulled this from the original docker.com source.

Yup.

A large spike at UTC 0:00 Feb 11

I’m also running about 40% more traffic overall this month so far.

That is a good idea. I will do that soon.

Not here… :frowning_face:

This is not correct. The restart of the container doesn’t wipe logs, only when you re-create the container, i.e.

docker stop -t 300 storagenode
docker rm storagenode
docker run ...

Again?

Your node has been suspended on 12EayRS2V1kEsWESU9QMRseFhdxYxKicsiFmxrsLZHeLUtdps3S.

us1

docker logs storagenode 2>&1 | grep -E 'GET_AUDIT' | grep 'failed' | wc -l
0

C’mon Storj what’s wrong?

Did you check GET_REPAIR as well?

Nice to get the node suspension in Saturday guys!
As far as I see I’m not alone with this message today.
Maybe yougot some troubles from a Storj side?

Wow. 3 nodes now suspended:

Node1:

docker logs storagenode1 2>&1 | grep -E 'GET_AUDIT' | grep 'failed' | wc -l
0
docker logs storagenode1 2>&1 | grep -E 'GET_REPAIR' | grep 'failed' | wc -l
2

Node2:

docker logs storagenode2 2>&1 | grep -E 'GET_AUDIT' | grep 'failed' | wc -l
0
docker logs storagenode2 2>&1 | grep -E 'GET_REPAIR' | grep 'failed' | wc -l
2

Node3:

docker logs storagenode3 2>&1 | grep -E 'GET_AUDIT' | grep 'failed' | wc -l
0
docker logs storagenode3 2>&1 | grep -E 'GET_REPAIR' | grep 'failed' | wc -l
1

A bloodbath unfolding?