Only one or two failures?
That can’t be. How huge are your logs?
Can you share your run command and uptime?
And how old are your nodes?
All 3 running on the same machine?
Only one or two failures?
That can’t be. How huge are your logs?
Can you share your run command and uptime?
And how old are your nodes?
All 3 running on the same machine?
https://forum.storj.io/t/node-suspended-randomly/17093/29
@javcia says…
I started getting random suspensions on my nodes after enabling QUIP. Already disabled on one of the nodes and looks like no more suspensions.
Do you have UDP/QUIC enabled?
If so, try disabling it.
If disabling QUIC stops suspensions, then we have a UDP/QUIC problem.
EDIT:
Adding a data point…
My node is more than 24 months old. Version 1.48.2 … I have not enabled UDP/QUIC. Therefore, my node displays “QUIC Misconfigured”. Recently, I had some ISP outage issue … fiber laser power problem, out of my control entirely…
Here are my stats:
Could you show what the errors on the GET_REPAIR are? Though, they may not show all of the problem, as you must have failed more for the score to drop this much. But it may give a clue as to what might be going on.
I have rebooted and now my logs are gone. ![]()
Ahh that’s a shame. Since you’ve had returning issues now, it may be a good idea to redirect your logs to a file to prevent losing information.
Yeah. I keep forgetting that. As Windows guy you always like to reboot without second thought because it can only get better… ![]()
Too tempting to insert a Linux v. Windows joke…
“OK → Next → Next → OK → Install virus → Next → OK → BSOD”
You can replace “install virus” with “allow Windows to rollout a new Windows version”
I love Geek humor!
The last MS Windows version I actually ran on anything for more than 10 minutes was XP… back in 2009…
My MS Windows knowledge is so out of date that I can’t actually use a Windows machine at all anymore. When asked to troubleshoot a Windows machine, I immediately try to find the terminal and type in lspci or lsblk … After trying man cmd I realize the machine is broken and needs Debian therapy.
Back to OP…
I suspect UDP/QUIC is the problem. My guess is the audit checks are timing out due to packet loss … maybe related to hardware speed and/or Internet connection quality. I briefly tried paging through OP’s posts to figure out what kind of issues were encountered in the past… but it’s fairly difficult to put everything together if I haven’t been paying close attention.
I might be completely wrong … it’s happened before, and will happen again… but I asked the question anyway.
The only question - why so small number of nodes?
We have a lot of nodes enabled UDP, but it hits only a small percentage of them.
UDP has too many variables to consider.
The entire pathway to the node needs to pass UDP packets cleanly. That doesn’t always happen. Since there is no way to ensure QoS of the entire pathway, a percentage of SNOs will have a problem… leading to failed audits.
It’s just a guess.
Maybe QUIC audit fail, followed by a TCP sanity check – then hard fail… I don’t know.
My ISP periodically can drop down my internet (one time in month about 1-5 minutes of downtime). When its has been happened again and internet has been up I got message about suspended nodes. It is first time when I got this messages. May be this information can help to troubleshoot.
Perhaps you are talking about the online score.
The downtime doesn’t affect the suspension score, which can be affected only by problems with audits, it’s not related to downtime.
The difference is huge - the online score can be 0%, but your node could be disqualified after downtime more than 30 days.
But in case of failed audits your node can be disqualified if audit score would fall below 60%
The suspension score is affected when your node online, answers on audit requests but return unexpected error instead of piece. If problem would not be fixed, sooner or later your node will be disqualified.
The known errors like “file not found” or “disk i/o” affects the audit score immediately.
So reducing of suspension score is much more dangerous than reducing online score. The reducing of audit score even worse - it leads to disqualification straight away.
It’s good that problems are being identified and fixed so quickly…
But it’s unclear if your post is meant to mean that OP’s issue isn’t connected to QUIC because the node seems to have re-entered suspension less than 3 days ago… Or if you mean that OP’s issue may be QUIC related because audits through QUIC have been reported to be problematic.
So let’s check:
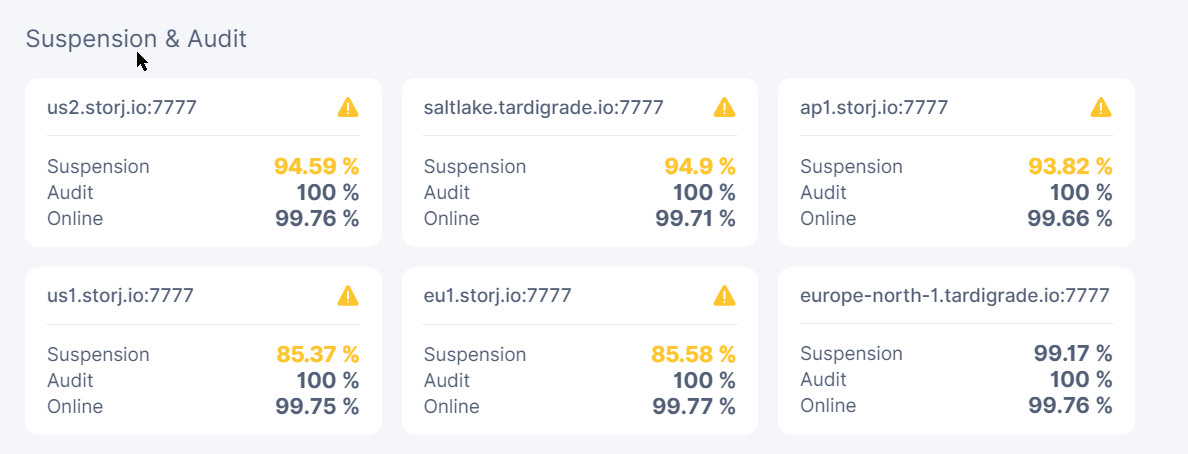
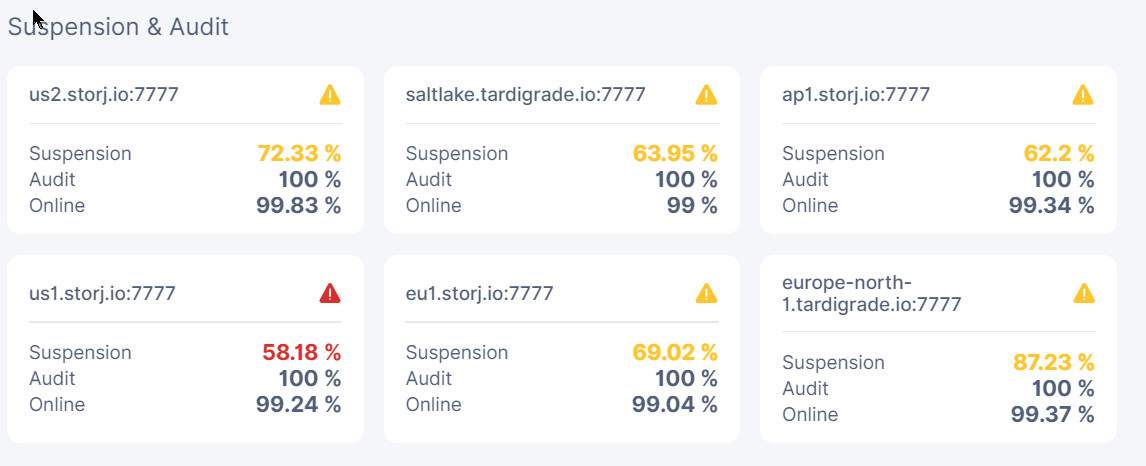
Node1 has recovered more but on 2 satellites it went down again:
docker logs storagenode1 2>&1 | grep -E 'GET_AUDIT' | grep 'failed' | wc -l
0
docker logs storagenode1 2>&1 | grep -E 'GET_REPAIR' | grep 'failed' | wc -l
7
Errors were:
6x write: broken pipe and 1x use of closed network connection
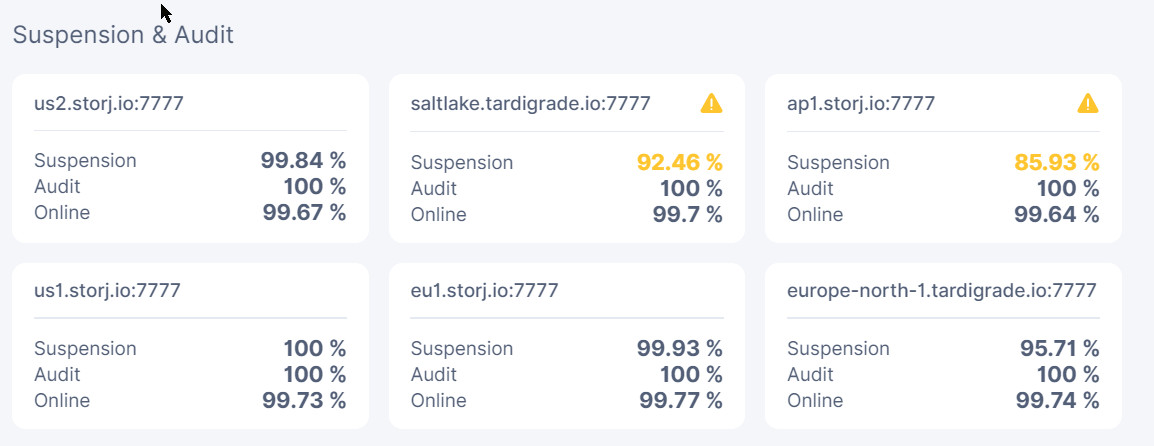
Node2 seems to be slowly recovering on all but one satellite:
docker logs storagenode2 2>&1 | grep -E 'GET_AUDIT' | grep 'failed' | wc -l
0
docker logs storagenode2 2>&1 | grep -E 'GET_REPAIR' | grep 'failed' | wc -l
0
Node3 which seems to be recovering on some and doing worse on other satellites:
docker logs storagenode3 2>&1 | grep -E 'GET_AUDIT' | grep 'failed' | wc -l
0
docker logs storagenode3 2>&1 | grep -E 'GET_REPAIR' | grep 'failed' | wc -l
2
Errors are: 1x use of closed network connection and 1x broken pipe
Maybe this? Load tests on Storage nodes?
What I see frequently now is this:
"error": "bandwidthdb: database is locked", "errorVerbose": "bandwidthdb: database is locked
I see that only for bandwidthdb, no other database affected it seems. Also, disk load does not seem to be so high that it should turn into locking.
i use to see that when my storage was heavy loaded, it might not seem like its loaded, but it most likely is… its because the write io might not look like a lot of work on the disk, you should check its latency with something like netdata
This.
Had the Suspensions too on nodes without QUIC enabled but HDD was in 100% load.