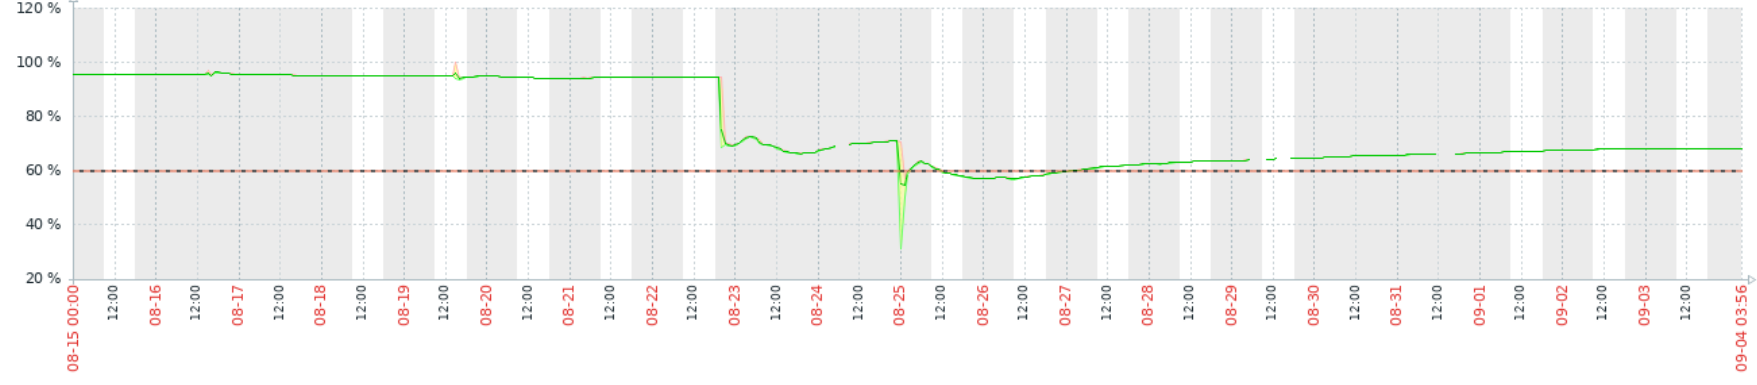
I also observe successrate degradation after migration to hashstore completed.
Thanks for the report. Unfortunately it’s quite hard to investigate without more data. Especially as we see different data
- It’s not clear how do you collect data (from logs? from prometheus metrics?)
- It’s not clear what’s happening in the background, any IO load on the node? Compaction times?
Do you have Prometheus or similar monitoring (Thanos/Victoria/…) with historical data?
Did you enable telemetry with your nodes (that would give me a chance to see data, even if it’s hard to convert it to usable data). At least if you share the node_id.
If you share node_id, I can also check the Satellite level cancellation rate (in the code it’s called success_rate/failure_rate, and it’s very similar).
I am open to join to call, and check monitoring.
In case of Prometheus monitoring, let me share some example metrics what we use:
Active compaction for all the servers.
sum by (...) (function{name="__Store__Compact",scope="storj_io_storj_storagenode_hashstore",field="current"})
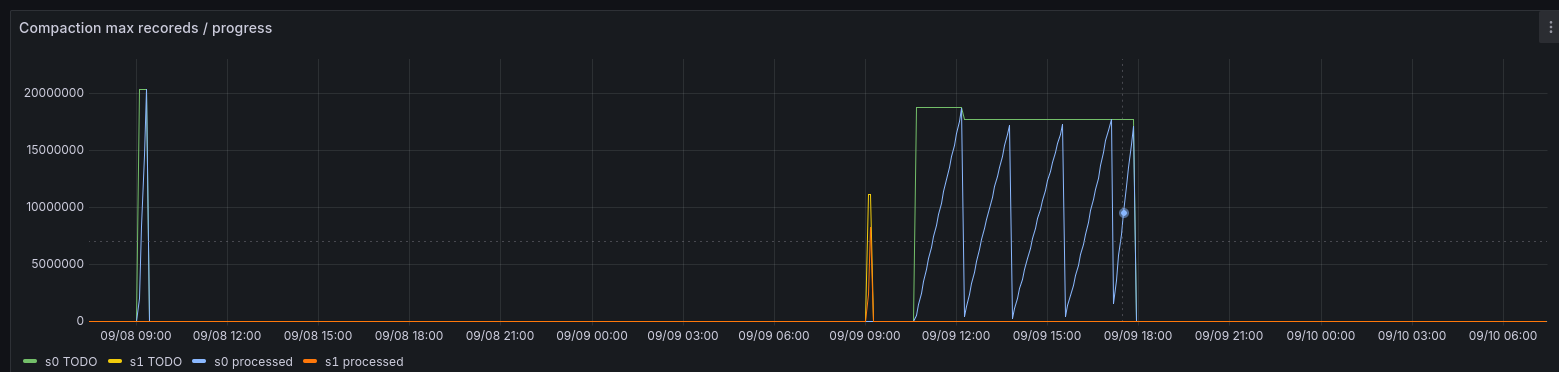
I also like the compaction details, but this can be used only for one instance:
hashstore{scope="storj_io_storj_storagenode",field="Compaction_TotalRecords"}
(Compaction is executed in multiple phases. Here the last compaction took ~7 hours. The first compaction decreased the number of records (Y), the next 5 re-compressed log files.
Rate of these compactions can also be interesting:
rate(hashstore{scope="storj_io_storj_storagenode",field="Compaction_ProcessedRecords"}[2m])
One randomly picked servers shows me 3-4k for longer compactions.
I would rather turn off the migration. Migration generates more IO load. You wrote it has been finished. On ext4 even the finished migration can cause problems, but you are on ZFS. So not sure, but I would give it a try