Strange. Even if I Ctrl+F5 I don’t see that.
@Stob Could you try an incognito tab or another browser?
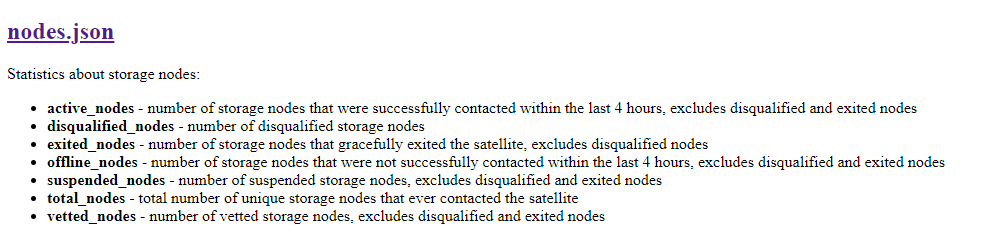
Thanks. I’ve reset Chrome and the page now shows the full_nodes description.
This is a great resource for SNOs, the transparency is highly appreciated!
@brandon, could you elaborate a bit more on the meaning of storage_free_capacity_estimate_bytes?
- Is this the total bytes available, or an estimate of how much data customers can store on the network (with or without erasure encoding expansion factor)?
- Does each satellite make it’s own assessment on the total capacity of the network (which is the reason why this value is similar for each satellite)?
- Or is this the capacity available to each satellite, meaning it need to be aggregated over the satellites to get the total available capacity?
So if I got this right, the total capacity of the network would go as follows (numbers are from 9th of June 2021):
- Calculate total stored capacity, by aggregating over the satellites:
storage_total_bytes = 8822579609707109 => ~8PB - Use one of the satellite’s estimates of the free storage space:
storage_free_capacity_estimate_bytes = 7173629764009581 => ~6PB - Add the two up, which totals to a Storj network size of approximately 14 PB, of which 55% is in use.
Do these numbers make sense? I was under the understanding the size of the network was in the 40PB range [reddit]?
Another option is to aggregate the storage_free_capacity_estimate_bytes over the satellites as well, resulting in approximately 46PB (with ~20% in use). But this begs the question why each satellites is approximating only a part of the network, and is so equally distributed over the satellites?
This is capacity advertised by nodes. Theoretical it can be used by customers, if nodes are not lie.
Nodes are automatically added to all satellites, so when a satellite observes a reported free_disk value, others will see more or less the same value (subject to metainfo fluctuations which will update the free_disk value for other satellites also). Thus you don’t want to add the free capacity per satellite, as this is essentially counting the same reported space multiple times.
The free_disk reported is showing bytes available on nodes. Thus this is post-expansion capacity available.
Also, it’s worth mentioning that the amount we report is a conservative/pessimistic estimate. taking total reported free per node does indeed result in high values of free_disk available (probably in the 40pb range seems right). But for a variety of reasons we want to be pessimistic about the amount we actually have free (to account for potential node pool fluctuations and accommodate growth planning more cautiously, to name two)
I working on a Prometheus/Grafana integration, which I (maybe) want to make publicly available.
Now some Stuff which i think would be nice to have implemented:
- Statistics Versioning incl. Changelog
- Satelitenames as key/value pair, instead of having them as key
So far so good, i now scrape all the Data via Exporter to Prometheus and can add Graphs to Grafana. i am not really a pro but i will create an initial Dashboard, actual State:

if someone want to contribute, let me know, i think there are more talented guys out here 
Another short Question regarding the numbers. If i want to show capacity vs usage i think i need these values:
- storage_remote_bytes - number of bytes stored on storage nodes (does not take into account the expansion factor of erasure encoding)
- storage_free_capacity_estimate_bytes - statistical estimate of free storage node capacity, with suspicious values removed
Regarding the Description of storage_remote_bytes i need to multiply it with the expansion factor (which is 2.7) to get the real amount of data stored across all nodes, right?
Looks good, mabe you can share your exporter already? Then others can create dashboards with it too.
My preferred way of creating dashboard is something like this (similar to how the storagenode dashboards are organized):
- Overview over the complete network (stats of all satellites combined)
- Toggleable overview over all satellites (could be like the one you made or a boomtable)
- Multiple rows with details per satellite (automatically generated for each satellite)
One could also think about separating the combined stats of customer-facing satellites and test satellites as the stats between those 2 categories will be quite different. (i guess)
Well I guess that’s a bit more tricky because only newly uploaded pieces have all erasure pieces stored on the network. Older pieces will have lost some of those already. other pieces might have gotten repaired recently and have all erasure pieces again. So 2.7 might be the maximum but the real average will be lower (but haven’t looked at the exposed stats, maybe there’s some more useful information there because I remember some stats about repair pieces etc?)
Thx for the Feedback, for now i have worked on to get the site public available: https://storjstats.info/
it only contains Data since yesterday evening, once i have a month of data i will adjust some settings otherwise ugly Stuff happens with the Graphs (depending on selected TimeRanges)
I have enabled the Option to play around with the Stats/Graphs, but without the possibility to save Stuff. If someone has a better Dashboard, let me know, then i will be happy to add it ![]()
I am already working to finalize everything, then i will share it on Github, so Pullrequests for additional Dashboards can also be done there.
EDIT: And here is the repo: GitHub - toconspiracy/storj-stats: Grafanafrontend for Statistical Data from Storj
We created a designated GitHub repo for proper project management around the public network
stats:
For any bug reports or enhancement requests, please open an issue on this repo.
Hey Everyone, Incase you missed it we published a blog post about these metrics; check it out if you are interested. Open Source and Open Data: Storj DCS Network Statistics
We are updating the way we calculate the values of storage_free_capacity_estimate_bytes.
Hey everyone,
I just wanted to let you all know about the latest updates to our public API. We have added two new metrics that will be useful for understanding the storage capacity of our network.
The first new metric is storage_free_capacity_estimate_vetted_bytes. This metric provides a statistical estimate of the free storage node capacity, but only considering vetted nodes.
The second new metric is storage_total_bytes_after_expansion This metric gives the total number of bytes stored on the network after expansion by erasure coding. Erasure coding is a technique that expands data and distributes it across the network, making it more resilient to data loss. You can learn more about our durability and expansion factors here: File Redundancy - Storj DCS Docs
Endpoint: https://stats.storjshare.io/data.json
We believe that these new metrics will be a valuable addition to our public API.
If you have any questions or feedback, please don’t hesitate to reach out. We would love to hear your thoughts.
Does this only count nodes that are fully vetted on ALL satellites?
I highly appreciate getting more detailed info via the public API, thank you ![]()
This only count nodes that are fully vetted per satellite. So, storage_free_capacity_estimate_vetted_bytes for (asia-east-1) AP1 only consider AP1 nodes.