As some of you have might noticed in this topic, i am working on a site where the statistical data provided by Storj is scraped and presented in an more human readable format.
After an initial version, where i had issues with the Scrapingintervall and displaying the numbers properly, I have switched from Prometheus to Victoria Metrics as scraper and TSDB (Time Series Database). Now the data will be scraped all 15 minutes and generates some nice Graphs. Also I have created an Dashboard (thx @kevink for Inputs), which is not perfect, but gives already some nice insights into the Storj network.
The project is now mature and stable enough to get used. So please check it out and let me know what you think about it
Play around with the dashboard, change graph queries and add new ones. Keep in mind that you cannot save them directly, but you can export them as json file, drop me some lines and I can add it for you.
The whole Project is available as Ansiblerole on GitHub, so you can spin it up on your own, or participate via Pull Requests. Maybe you want to share your own Dashboard?
Great job!
Since it’s not based on prometheus, I won’t set it up locally but I guess it is not needed, I can just use your nice dashboard
Some notes about the dashboard:
Many graphs have no unit which results in huge numbers that are hard to read, like 64024345 remote segments which is ~64Mil. So I changed all of those to have the unit “short” in order to automatically get converted to 64.02Mil for better readability (I made a PR on github, was the easiest way to share the changes)
I’m missing stats about disqualified nodes in the overviews
It would be nice if the per satellite stats and the satellite details stats could be calculated as a network overview stat like at the top (possibly divided by test satellites and customer satellites). E.g. stats like registered customer accounts on the whole network, remote segments on the network, healthy pieces stats for customer satellites. Most people will likely only look at network stats and not the stats of each satellite.
Personally i prefer absolute units, but I see that it makes sense to have them shorted. I have merged the PR and released it, thx for the enhancement . I have put your other points as open issue in Git so I can keep track of it Dashboard enhancements · Issue #2 · toconspiracy/storj-stats · GitHub
Thank you for the hint, I think I found the issue, I had (by mistake) set two DNS entries, one which was set by default by the DNS Provider
I assume in your case you got the wrong IP which lead to that Issue. It can take up to 24hrs until the correct IP is getting fully distributed, sorry for that.
Jepp, seems so, was reported that way. But AFAIK that’s a test satellite and not productive. It is also the only satellite which has 0 min healthy pieces. Personally i think that might happened during a failed deployment or something similar, but that’s exactly what testsatellites are for. So i think everything is fine as long it does not happen on PRD Satellites.
Yes I think so too. It’s a test satellite so it makes sense to also test how and when segments get lost. Therefore it is also good to separate test satellites from customer satellites in combined stats as to not give the impression that storjlabs lost files (as it may only be an intentional test on a test satellite).
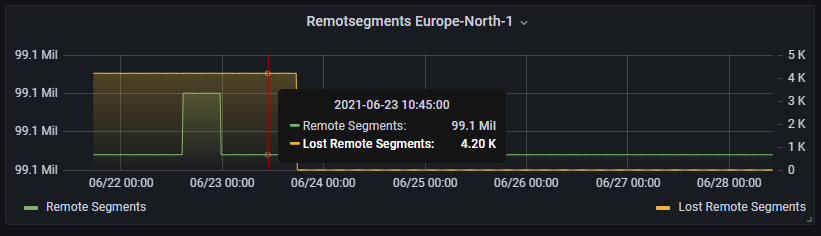
But what’s surprising to me is that the stats go back to 0. How can you lose 4.2k segments and then suddenly claim you haven’t lost any segment? That’s not how this metric works. So either storjlabs made intentional corrections or your scraper config might have been wrong shortly?
I was also surprised for the same reason and checked the source (https://stats.storjshare.io/data.json). It is set to 0 now, but at that time it was at 4.2k. The scraped data is stored directly as value and almost all numbers are displayed directly (as in this case).
Yes i had some wrong settings in the scraping process and fixed them. To ensure no wrong data gets shown i deleted all data and begun from zero, which was on the 21th June in the evening.
Also i do not expect calculation issues as the only part where I calculate the values are for unvetted nodes and some in the overview. Those are calculated in the frontend, not in the Database. So i do not think it is a scraping issue, the values shown are directly provided by storjlabs. Either they were wrongly reported and fixed or somehow reset. Maybe a storjiling can shed some light?
imho that makes that metric kind of useless. are you really expecting to lose segments per hour?
even the past 30 days metric is kind of fishy considering the goal is to not lose a single segment.
So imho this metric should be a counter that never gets reset.
The remote segment metric isn’t getting reset every hour or every 30 days either or is it?
(It also means that the metric needs to be displayed/treated differently as it is a rate now - lost segments per hour - and not a counter like the remote segments metric…)
@Arkina is it possible to scrape the lost segments metric as a counter that never gets reset? The total amount of lost segments is a lot more interesting than the rate of lost segments (as this will likely never show up because it will be only a very short event)
Phew, well scraping is only taking values and put it in the DB so there i wont touch it. Maybe i can change how they are calculated/shown in the frontend with a delta value, but even then i am not sure if the result is correct. Would need to have a look into that and play a bit around. But at least a historical view is visible.
with prometheus exporters it is possible to make it a counter but the problem is of course that the counter gets reset when the exporter restarts… guess it might be the same for the db you use.
displaying the value differently on the frontend won’t work. You could of course display the sum over time or something like that but it would always only use a certain timeframe, unless you always make the query calculate the data from the start of your database…
So the only reasonable way to handle this would be to get storjlabs to expose this metric differently.
Yes i see, maybe it would also be possible, but i would not want to implement it for these reasons:
i assume it would take more time to implement in comparison of the outcome (some sort of expense/income thing)
i do not want to manipulate the stored sourcedata
it would be more like a workaround than a solution
i’d expect the provided stats will be improved/adjustet, i mean its a pretty new thing storj provides. I think now they get even more feedback for it as those numbers are more visible
So for now i leave those numbers as they are, and try to find if i can improve them in grafana as soon as i find some time todo it.

 . I have put your other points as open issue in Git so I can keep track of it