Hello everyone,
I have set up a Grafana dashboard as described here:
I have also made the adjustments that had to be made for the dashboard to display anything at all (create new Dockjer image with the customized config files)
My output now looks like this:

So far everything is ok, but Upload, Upload canceled and Upload rejected do not match, I can’t get to 100%
The avarage piece size doesn’t look right either, as you can see here again

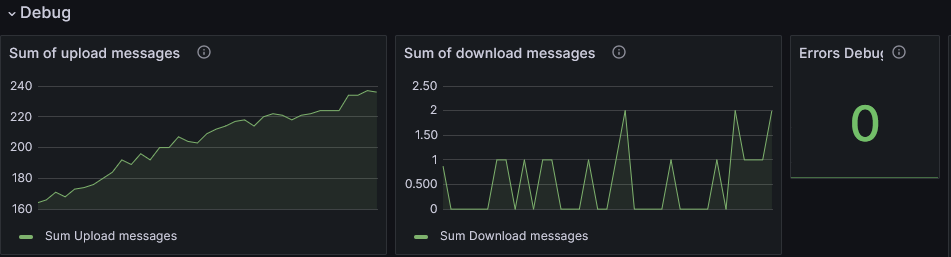
What also surprises me is that under Debug the Sum of upload messages keeps growing, behind the I is this text “This should be around -20<0<20. Theoretically it should be 0 if all uploads successful/canceled/failed/rejected are summed up but restarting the exporter can miss a few messages.”
Could it be that upload rejected in the logs are now displayed like this?
2023-12-26T06:48:55Z	ERROR	piecestore	upload failed	{"process": "storagenode", "Piece ID": "TCFALGRMZKWPCEEPOH3X3AXEXHXMEREF56HYBKOOIP6MJXVOOLMQ", "Satellite ID": "12EayRS2V1kEsWESU9QMRseFhdxYxKicsiFmxrsLZHeLUtdps3S", "Action": "PUT", "error": "unexpected EOF", "errorVerbose": "unexpected EOF\n\tstorj.io/common/rpc/rpcstatus.Error:85\n\tstorj.io/storj/storagenode/piecestore.(*Endpoint).Upload:533\n\tstorj.io/common/pb.DRPCPiecestoreDescription.Method.func1:243\n\tstorj.io/drpc/drpcmux.(*Mux).HandleRPC:33\n\tstorj.io/common/rpc/rpctracing.(*Handler).HandleRPC:61\n\tstorj.io/common/experiment.(*Handler).HandleRPC:42\n\tstorj.io/drpc/drpcserver.(*Server).handleRPC:124\n\tstorj.io/drpc/drpcserver.(*Server).ServeOne:66\n\tstorj.io/drpc/drpcserver.(*Server).Serve.func2:114\n\tstorj.io/drpc/drpcctx.(*Tracker).track:35", "Size": 1703936, "Remote Address": "5.161.220.231:37634"}
2023-12-26T07:00:32Z	ERROR	piecestore	upload failed	{"process": "storagenode", "Piece ID": "VOSECYNVPISWOOJJSX7FKUCI2PRZ54NZHNQAO4Y55K5LSYNS2CNA", "Satellite ID": "12EayRS2V1kEsWESU9QMRseFhdxYxKicsiFmxrsLZHeLUtdps3S", "Action": "PUT", "error": "manager closed: unexpected EOF", "errorVerbose": "manager closed: unexpected EOF\n\tgithub.com/jtolio/noiseconn.(*Conn).readMsg:225\n\tgithub.com/jtolio/noiseconn.(*Conn).Read:171\n\tstorj.io/drpc/drpcwire.(*Reader).ReadPacketUsing:96\n\tstorj.io/drpc/drpcmanager.(*Manager).manageReader:226", "Size": 65536, "Remote Address": "5.161.211.187:33536"}
I have some of these entries
Has the output of the log changed so that I have to adjust this in Grafana so that the dashboard displays the info correctly? And what does the output mean? I also have this in the logs but it is explained by itself
2023-12-26T00:05:03Z INFO piecestore upload canceled (race lost or node shutdown) {"process": "storagenode", "Piece ID": "3LB7RBOW3ORFSUZRMCLBTULP2TEKOWEXE2YJOH4GW2AEY5IE4ACQ"}
I hope you can help me so that I can set up the dashboard correctly and, if necessary, do something to make the errors disappear
Thank you very much
If you still need information, I will of course be happy to provide it
Greetings CubeFan