Full compose multinode deployment for storj-node with exporters and grafana, ideal for mass node deployment.
This is a compilation for multiple solutions, put together in one simple to use package.
For detail on all solutions and credits, check out github. It would not be possible without them.
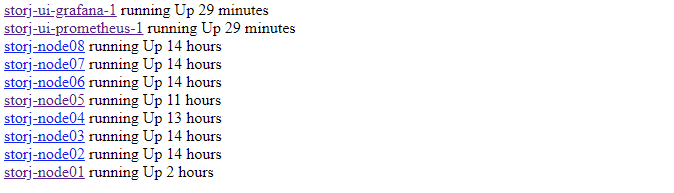
simple website for host displaying all available web interfaces
storj multinode optional deployment
Tutorial video
Tutorial covers everything from docker instalation to deployment and configuration. Included full closed captions in case you have problem understanding my accent and transcript of all used commands in comments.
UI Preview
Grafana storj node statistics (storj-exporter and storj-log-exporter)
I would also like to add monitoring and alert system. Something that would at least send an email to warn about issues.
I was thinking of sensu, since I have experience in large scale with it, but that may be an overkill.
Does anybody have any experience/suggestions with such monitoring for storj/docker?
yea, I plan to look into multiple solutions to have more options
not sure what would be the best yet
mail notifications are basic and I certainly want those. then different type of instant notification for serious issues, like node crashing due to disk not being available and such.
grafana alerting seems to be moved from graphs to dedicated section which does not have option to import/export.
so this will be a no-go, at least for now