Hmm yeah that is an interesting scenario. Hard to tell what’s going on. But if it helps in your case, that’s good.
64K blocksize is interesting, makes sense for a vm but not neccessarily for storj.
was getting something else so dug up these…
i’m sure i got a few more of these tests somewhere they are bit old but nothing much has changed regard the filewalker nor my storagenode size since then.

storagenode boot 14 tb or so… cached in l2arc
i think this might have been from my old setup with 3x raidz1 and cached (filename just say cached)

was migrating the node so here is after it was moved to a single raidz1
and so are the rest.
this one is storagenode boot 60+ minutes peak iops on 1x hdd worth of iops

also a storagenode boot taking 3 hours the spike is a big deletion, again 1x hdd worth of iops (raidz1)

and yet another one, pretty sure all of these are with the l2arc on… must have the data from the tests without l2arc somewhere else…
this one was 1hour and 40min, the io wait is much lower tho… i know this is not iops… but it was what i used at the time.
so basically i was migrating and figured it might be nice with some data on how the reduced iops going from a pool of 3x raidz1 to a 1x raidz1 would affect the filewalker.
the first 40min one was me grabbing a bit of data before i left for a baseline.
then the 3 hour one was a cold start and the 1hour and 40 min was with a warm cache on 1xraidz
i know the graphs aren’t really great to look at… ill remember to make better next time… they are really crappy, but i was mostly just grabbing the graph data for my own usage to compare against the previous ones…
but it’s quite clear the reduction in iops… (or it was quite clear to me at the time atleast)
that the reduction of iops basically linearly affecys the filewalker process time.
much like with scrubs… it’s almost linear, twice the iops half the time.
ofc storagenode activity would also greatly affect this especially if one is running a bit high on iops to begin with…
if we say the storagenode / nodes use 10% then it wouldn’t really affect the filewalker much… but if it takes 50% of the iops then it’s already double the time.
75% used by the storagenode and we got a 4x in time in the process
I can’t really use smaller blocksize with raidz and ashift=12, so I use 64K everywhere, though I don’t know maybe using larger one would have been better, but that probably risks getting the ext4 metadata (or the db data) fragmented to multiple blocks.
I found that 32 bit raspian on the 4GB PI 4 doesn’t use all the memory that it could for disk cache.
I’ve set vm.vfs_cache_pressure to 10 (from 100) and now it is using all the spare memory for cache. I’ll have to wait for another update to see if there is a difference.
Is that so? How did you conclude that? My Pi4 currently uses most of its RAM for cache, but I’m not sure what kind of cache…:
MiB Mem :   3906.0 total,    432.1 free,    351.4 used,   3122.5 buff/cache
MiB Swap:      0.0 total,      0.0 free,      0.0 used.   3270.2 avail Mem
I’d be interested in your findings ![]()
As I am becoming specialized in hosting Storj nodes on SMR drives ![]() , I’m very amused to announce that my nodes take:
, I’m very amused to announce that my nodes take:
- 13 hours for browsing 1.3TB of data on a 3.5" SMR drive
- 20 hours for browsing 1.3TB of data on a 2.5" SMR drive
- 25+ hours (and counting) for browsing 1.9TB of data on a 2.5" SMR drive… it’s not over yet…
Honestly, even though they are cheap SMR drives, that feels like a LOT of time for browsing all that data… They scan roughly at 150 to 200 IOPS for some, the slowest scans at around 80 IOPS…
Not sure how long they’re gonna live with such catastrophic pressure every time nodes update but… well the oldest one has been enduring this for one year and a half now. We’ll see ^^
SMR drives are no different from CMR drives in read operations.
Besides, my 5400RPM Ultrastar 3.5" only scan with ~80 iops too… So your drives are actually pretty great.
And as long as our ingress is this low, SMR drives are probably completely fine.
True as long as they read only. But because they are SMR, whenever there are write operations at the same time, it disrupts them much more because of the back and forth the disk has to do between its internal CMR cache and heavy rewrite operations to actually put the data within an SMR section.
You think? I thought they were pretty weak considering some people have thousands of IOPS. Is it only achievable with advanced caching systems then? Or professional hardware maybe?
But still, even though 80 IOPS might be “normal” for slow consumer grade disks, it sounds way to low to me ![]()
I mean if it already takes 13 hours for 1.3TB of data on my 8TB 3.5" SMR drive, it means it’s gonna take roughly 80 hours when it’s full! That’s more than 3 DAYS! The disk is gonna melt!! ![]()
![]()
Yeah that might be the problem.
For me too ![]() But my ultrastars (which are not consumer grade, but only 5400RPM) only scanned with 80 iops so… yeah not so fast…
But my ultrastars (which are not consumer grade, but only 5400RPM) only scanned with 80 iops so… yeah not so fast…
This might be because of your first point, we currently have lots of deletes which are write operations, which slow your drive down? Because my 80 iops 8TB drive with 7.4TB data needed almost 12 hours for the filewalker to finish. So still considerably faster than yours.
So maybe my assessment wasn’t quite right, your iops look great in theory but with some write operations at the same time it does seem to be worse if you already need 13 hours for 1.3TB of data.
from my testing scrub’s, filewalker and migration goes faster with larger block sizes… i’m running 256k
seems to be a nice spot, doesn’t affect the cache and ram to much and is still a lot lower iops than 128k
i tried running 16k block sizes, 32k 64k 128k 256k 512k and 1mb
16k is basically impossible to migrate and scrub, took days for workloads that took 14-16 hours on 512k, also the smaller recordsizes makes the checksum data take up a lot more capacity, low recordsizes are very for data granularity ofc,
for ZFS 128k is on avg the best choice due to how hdd behave in general for this bandwidth and iops performance, and due to zfs using variable recordsizes, it a 13k file would be placed in a 16k block anyways… even if one is running 512k
so due to that larger blocks are often preferred… however larger blocks also means more cache or RAM being cleared for data processing / transfers.
so if one goes to high caches will repeatedly flush especially if you are moving or processing like say 13k files located in 16k records… so if we say you are processing 1000 of those, that is 16MB of data of cache being cleared to receive the blocks, but if you are running 512k records it would clear 512k x 1000 so 512mb of cache or RAM…
thus there is a point on diminishing return or where other issues that will slow down workloads immensely… which is sort of why after many months of testing and migrating my pool like 5-6 times i settled on 256k, so twice as much RAM / cache flushing but still twice as fast…
and cuts a lot of time of migrations and scrubs…
--------- on another note ---------
i finally got around to updating my nodes after some 20 some days of uptime…
maybe my pools are just to active for me to see… but really didn’t seem much sign of the file walker this time…
tho now i am observing my iowait… it does seems to be dropping now
my netdata had gone masked for some odd reason, so data is incomplete even tho it was started up shortly after i updated my main node.

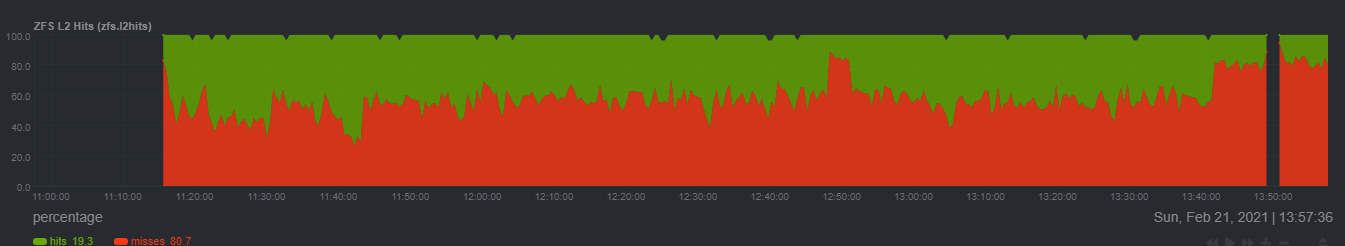
i do like how my l2arc is starting to warm up… lol
that is pretty good numbers for the arc… often not like that but it happens when there is load on the system…
going to give this a few hours to soak so the proxmox graphs becomes a bit more useful…
but yeah… filewalker…
the bump in iowait was the 14.75tb node doing the filewalker on a big warm l2arc.
total filewalker time was 2hr and 20 min one can see it on the l2arc pretty clearly.
my netdata seems to be breaking down again again again…
i know my iowait is kinda terrible, have a disk that didn’t really recover after the cold snap we had here…
and apparently it looks much better when the cpu is busy… no time to wait or whatever…
if anyone can explain why that is i would like to hear it.
yes i’m looking at you @Pentium100 O.O you usually have most of the answers i’m looking for ![]()

The block size is fixed on a zvol (also, not possible to change without recreating the zvol). The default is 8K, but combined with raidz and ashift=12 small block sizes take up double the amount of space on the pool.
Though, I guess for the node data I could have gotten away with a larger volblocksize, normally it would mean that the database writes and metadata writes turn into a volblocksize-sized write. I guess if/when I start a new node I could try different volblocksize, I don’t really want days of rsyncing for this one ![]()
Scrub takes 18 hours or my pool with 17.5TB of data.
I can think of two reasons, but do not know if this is true:
- Maybw the CPU can run something else while it is waiting for the drive to read a sector when the system is more loaded.
- Higher load on the CPU could reduce the speed at which the data-reading process runs, so the process reads data more slowly, loading the drive less.
I wonder what does iostat -x 5 say about the drive IO utilization in percent during heavy loads on the CPU.
which cpu ![]() so yeah i bet they can do that.
so yeah i bet they can do that.
hadn’t considered that, but yeah i think that sounds very possible.
haven’t really loaded the cpu, just allowed a vm with 50 weight / cpu time (very very low… default is like 1000) to take the excess cpu time and put it towards something useful… so there shouldn’t be any real pressure on the cpu… most likely just that it has more time to sit around waiting…
been seeing about the same number there 16hr i think i use to get on my 14.5tb
but last time not sure what went wrong… took nearly 4 days… maybe because of higher activity or a hdd that is going bad…
i did some tests on that… zfs doesn’t use 4k blocks… ashift=12 is essentially 8k blocks, this is also why you see the oracle documentation talk about that you should minimum get 2x compression for it to be useful, because if you compress a 8k block by 2x then it will fit in a 4k block.
thus if zfs didn’t use 8k blocks compression would basically not work for certain recordsizes…
i haven’t checked if zfs might write 4k block / records if one disables compression… but it’s certainly possible.
if you write smaller block sizes you run into the issue of how it fits into the sector sizes, if you force a 4k hdd into writing 512k sectors you will only get 1/8 the capacity because each sector can hold 4k.
ofc if it’s a 512e drive it will do both 4k and 512 because it basically just stripes the 4k blocks across multiple 512byte sectors.
because zfs well minimum use put 8k in a block if you force the zvol to run 4k it will only wirth half of each record with data… and then if you got compression on even less…
ofc zvol is used for vhdd’s / hdd emulation so it sort of has it’s own rules i’m not super well aware of, only played with it very little…
if the disk isn’t in a raid type configuration in the virtual system, i’m not sure what size blocks one should use to be fair… if using something like ext4 then one might run into lots of considerations regarding block sizes that is irrelevant to zfs.
in brief… my experiments with blocksizes related directly to zfs and how they would apply to zvol i think would depend a lot of what kind of file system one placed on the zvol.
zvols expand in size if the volblocksize is too small on raidz pools.
The reason is something like this: let’s say the volblocksize is 8K and I have a 6-drive raidz2.
The 8K would be spit up into 2x4K and written to two drives. Then parity would be written to two more drives. However, two remaining drives would not have anything written to them. The problem is that it is not impossible to write anything to those two drives because the parity blocks are already used.
The result of this is if I create a 100GB zvol (volblocksize=8K) and fill it with uncompressible data, it ends up taking 200GB in zfs list.
The minimum volblocksize for ashift=12 should be 64K for vdevs with fewer than 1+ data drives - 17 drive raidz1, 18 drive raidz2…) or if you have more drives in the vdev, then it should be the number of data drives multiplied by 4K.
i think i only did testing on raidz pools when tinkering with the recordsizes and learning about ashift… initially i had mine set to 12, but since a large portion of the disks i have in the server is 512b, then i ran into iops limitations because of it using 8 x 512b to write a 4k block…
so on a hardware level i was basically forced to either accept the offset in performance and keep ashift 12 which is pretty cool because one can then use both 512 and 4k hdd’s in those pools.
but i decided to go down to ashift 9 (512) so my hardware would function optimally
if you remember a while back you had me do some tests on a zvol or maybe just write some blocks to see if i had data magnification… my hardware being 512 would also explain why i didn’t see any data amplification.
i did find some pretty big advantage for 4k tho, my ssd is made for functioning as a parallel direct cpu ram swap drive, and in the manual there is a list over the RAM requirements for operating the ssd as a swap drive… if i am running 512b sectors on it, then it’s like 24GB + of maximal allocated RAM to keep the meta data for the swap data on the ssd.
if the ssd ran 4k it would only be 3GB ram required, so thats pretty neat…
but yeah running smaller record or blocksizes is a no go on any raid related stuff…
optimal on the hardware is around 64k to 128k no matter the size of the setup…
but thats just the inherent optimal general performance spot for the physical hardware… doesn’t mean the capacity will be well used by the raid…
ofc there are also more things to consider than just this… like say if you had to handle only 1k files… then you would run out of capacity in pretty fall order… atleast on some file systems…
not sure if zfs can actually group multiple small files into a record… but it wouldn’t surprise me… i mean oracle has a setting for zfs where it will go to 16mb… i think FreeBSD can do that also… the linux zfs hasn’t gotten that yet…
not sure what it’s even used for… i suppose when dealing with massive databases one has to think on rather different scales.
maybe they simply ran out on inodes… even tho peopel do claim zfs has like infinite…
or maybe it was simply to be able to manage so large datasets…
i’d imagine scrubbing a data center wide zfs pool might take a bit… especially if the recordsizes are to small… one has to process all the checksums after all…
ofc going to 16mb recordsizes would also give an awareful lot of extra room for checksum and extra data on each record… maybe thats why they go so crazy on that.
sadly it doesn’t work like that… the disk is basically twice as fast in the beginning …
the problem you are seeing is that SMR writes are slow, this slows down your reads, because like kevink said, your reads are essentially the same as a regular CMR HDD at 5400 RPM.
i think the latency on 5400RPM is close to 4ms, 7200 RPM is like 2 maybe a bit more and 10k is like 1ms.
ofc the penalty of this lower seek latency comes at the power used to keep the RPM.
so your hdd will run cooler and use less watts, but slower without a doubt.
not only will the hdd have 50% the speed when getting near full, ofc not for all data but for any data that is on the inner part of the disk… the closer the read write hdd gets to the axis of the disk rotation the slower the disk will pass below the head, which is what gives the about 50% loss in speed when near full… meaning like 80-90% full
adding multiple nodes will help spread out the writes, or adding a write cache will also help make random iops into sequential… which are faster, but really SMR is a major handicap…
regarding iops, i think iops is like 200-400 on a 7200RPM hdd… the enterprise drives are rarely multiples faster, but sometimes if they are really nice… most often it’s like endurance related, so they had hold up to 24/7 operation, so if you are using consumer drives these is a very possible chance their bearing will fail in about 2 -3 years of operation.
read iops can be about double… and ofc the slower latency will also reduce the iops, there really isn’t a minimum iops for a hdd… because you could essentially write a data pattern that would take weeks to read… if not years
SMR is nice for storage capacity, and mainly read activity… they are terrible for writing…
if you really want to use it, you can fill the node on another hdd and migrate it to the SMR later when it’s full… but the bearing wearing out is a thing to make a node of…
you want hdd’s that are rated for 24/7 operation
Good idea! Even though… The migration process is going to be a Pain, with a capital P as it’s gonna involve only writes to the SMR drive, for millions of files! ![]()
But yeah SMR drives become OK for Storj Nodes when they’re full, I think you’re right ![]()
sequential writes shouldn’t be to bad on the SMR actually, ofc i wouldn’t say it’s 100% but if nothing else then it’s optimal conditions because you would only be writing to it…
it’s a bit like when you start multiply copies to any type of magnetic recording hdd, because the head has to move around more it slows down the process, so it takes much longer than twice as long…
start a 3rd and a 4th copy and it usually starts to choke up… start 100 and it might take a week.
you could keep the partition you grow the node on at a size so it will fit and the directly mirror / clone the partition from a CMR HDD to the SMR HDD.
then the issue with small files will not exist because it will be working in basically only sequential writes, so you should get… whatever the SMR can take… ofc that may be where the SMR again sets some very fixed limits…
but on CMR to CMR hdd’s you would get something 100-200mb/s… so 8tb would be max of something like 80000seconds … 3600 sec in an hour so 22 hours or something maybe as low as 11 but i doubt it …
100avg would be pretty good if you can manage that.
and do make sure you use something that can resume the process, sucks to not be able to start it up again for whatever reason.
@stefanbenten could you please check the status of this ticket?
No substantial progress at the current stage.
There are more pressing tasks being handled currently unfortunately 
I just run into to the same problem. 5month old node on a slow usb WD drive.
If you’re running on Windows turn off drive defragment because if it hits the same time as the Storj scan its game over.
For me god knows how long the scan takes only noticed this issue as memory usage started shooting to 2 gigs then windows kernel kills the node, restart and scan starts from the beginning. Looked like a never ending cicrcle but yesterday the 1.66.1 update might did something? Looks like the scans are less aggressive. 24h since the node is up, still 100% utilisation so scan is running but memory only at 120mb.
Just some feedback
Perhaps your USB WD drive is SMR. If it’s 2.5", then probability being a SMR close to 100%.
You may try to disable scan on startup:
What is the benefit of having the scan enabled?