Successrate.sh comparison thread

Hello!

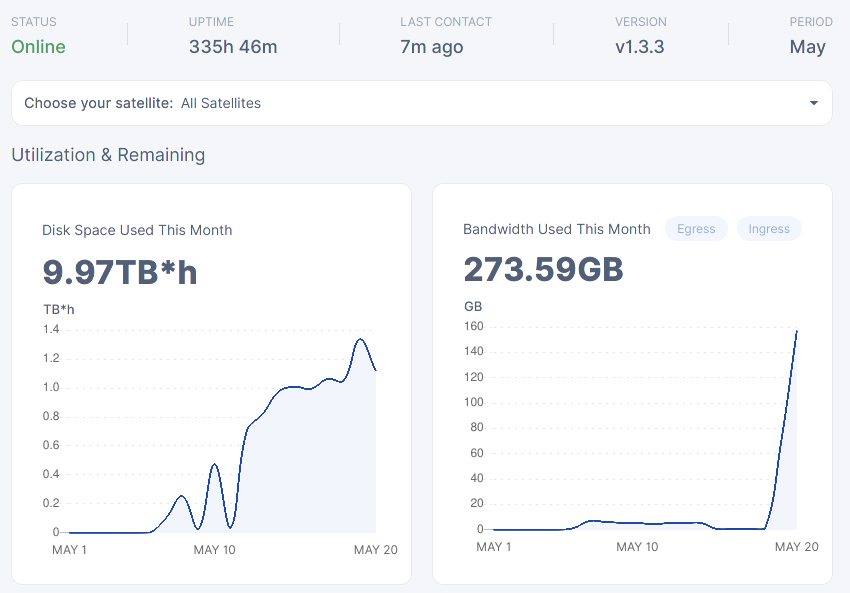
Hardware : Some random server i had laying around, 60gb ram, 2TB nvme SSD
Bandwidth : 1Gbit synchronous
Location : Germany
Version : 1.3.3
Uptime : 335h

Joined the network two weeks ago:

========== AUDIT ============== 
Critically failed:     0 
Critical Fail Rate:    0.000%
Recoverable failed:    0 
Recoverable Fail Rate: 0.000%
Successful:            350 
Success Rate:          100.000%
========== DOWNLOAD =========== 
Failed:                1 
Fail Rate:             0.015%
Canceled:              5 
Cancel Rate:           0.073%
Successful:            6824 
Success Rate:          99.912%
========== UPLOAD ============= 
Rejected:              0 
Acceptance Rate:       100.000%
---------- accepted ----------- 
Failed:                2 
Fail Rate:             0.002%
Canceled:              44779 
Cancel Rate:           35.202%
Successful:            82425 
Success Rate:          64.796%
========== REPAIR DOWNLOAD ==== 
Failed:                0 
Fail Rate:             0.000%
Canceled:              0 
Cancel Rate:           0.000%
Successful:            1 
Success Rate:          100.000%
========== REPAIR UPLOAD ====== 
Failed:                0 
Fail Rate:             0.000%
Canceled:              1078 
Cancel Rate:           39.429%
Successful:            1656 
Success Rate:          60.571%
========== DELETE ============= 
Failed:                0 
Fail Rate:             0.000%
Successful:            2075 
Success Rate:          100.000%

How does this look? :smiley:

1 Like

Hey @foxo, welcome to the forums!

Your results is right around what most good nodes see atm. Upload success rate might seem low, but the majority of those canceled uploads are actually finishing just fine. The cancellation happens right when the node is finishing up the transfer and the piece is still stored, and later can be downloaded as well. You’re paid for these pieces like normally, so despite the weird log line, the pieces actually arrived on your node just fine.

Good! Do you think i could “downgrade” the nvme to some regular hard drives with no consequences?

You may see a slight difference in numbers, but nvme is really overkill and way too expensive to be running a node on. A decent HDD should be just fine. Just avoid SMR ones. PSA: Beware of HDD manufacturers submarining SMR technology in HDD's without any public mention

These were some leftover nvme, so i don’t care much anyway haha
Also does it make a difference to have a small node and expand it as soon as it gets filled up, or should i just make it huge from the start? Right now i have 500gb of storage reserved to Storj, but as i said i could ramp it up to 2TB.

It doesn’t matter, the only thing that has an impact is whether it’s full or not. The total size of the node doesn’t impact traffic at all.

So happy i finally updated to v.1.5.2

========== AUDIT ==============
Critically failed:     0
Critical Fail Rate:    0.000%
Recoverable failed:    0
Recoverable Fail Rate: 0.000%
Successful:            974
Success Rate:          100.000%
========== DOWNLOAD ===========
Failed:                0
Fail Rate:             0.000%
Canceled:              21
Cancel Rate:           0.805%
Successful:            2587
Success Rate:          99.195%
========== UPLOAD =============
Rejected:              0
Acceptance Rate:       100.000%
---------- accepted -----------
Failed:                0
Fail Rate:             0.000%
Canceled:              4780
Cancel Rate:           43.633%
Successful:            6175
Success Rate:          56.367%
========== REPAIR DOWNLOAD ====
Failed:                0
Fail Rate:             0.000%
Canceled:              0
Cancel Rate:           0.000%
Successful:            469
Success Rate:          100.000%
========== REPAIR UPLOAD ======
Failed:                0
Fail Rate:             0.000%
Canceled:              863
Cancel Rate:           42.914%
Successful:            1148
Success Rate:          57.086%
========== DELETE =============
Failed:                0
Fail Rate:             0.000%
Successful:            1181
Success Rate:          100.000%

i take it that this is the new normal had a successrate of atleast 80% before i updated, also did a few bios changes, which now in hindsight was at a bit of an inopportune time.

I’m at about 75% Upload success since 00:00:00 UTC June 1st … when my logs rotated for the month.

V 1.5.2 … updated automatically via watchtower less than 48 hours ago.

Where do I find this script and can it be run under Windows?

1 Like

hmmm weird, just tried the new successrate.sh script… but still get the same result…
seems like my bios battery in the server is dead and because i had pulled the plug on it recently it dropped its bios settings and my quick reconfiguration had missed a lot of apparently very important settings.

so better get those documented when i get them fine tuned again lol i WAS AT 85% now i’m up at 65%
always document every thing… atleast it’s not like a year since i did the bios tuning… lol i was barely even done…
tho one thing that i do kinda wonder… is if the successrates doesn’t match the actual successrates because the logs are wrong…

then how do i know that it actually changes my successrates, as it wouldn’t show up in my bandwidth… in fact lower successrates may raise my bandwidth usage with worse node performance…

so i’m just wondering if i’m actually tuning or just [censored] …

Thank you it works now:

========== AUDIT =============
Critically failed:      0
Critical Fail Rate:     0.00%
Recoverable failed:     0
Recoverable Fail Rate:  0.00%
Successful:             289
Success Rate:           100.00%
========== DOWNLOAD ==========
Failed:                 15
Fail Rate:              1.26%
Canceled:               129
Cancel Rate:            10.80%
Successful:             1050
Success Rate:           87.94%
========== UPLOAD ============
Rejected:               0
Acceptance Rate:        100.00%
---------- accepted ----------
Failed:                 15
Fail Rate:              0.04%
Canceled:               11837
Cancel Rate:            34.97%
Successful:             21996
Success Rate:           64.98%
========== REPAIR DOWNLOAD ===
Failed:                 0
Fail Rate:              0.00%
Canceled:               0
Cancel Rate:            0.00%
Successful:             0
Success Rate:           0.00%
========== REPAIR UPLOAD =====
Failed:                 0
Fail Rate:              0.00%
Canceled:               1060
Cancel Rate:            16.36%
Successful:             5419
Success Rate:           83.64%

It all looks good, except for the high cancel rate of uploads. I guess that’s due to my remote location in Thailand.

Hi all,

hope you’re all doing well in these times of pandemic.

I wanted to ask something about the success rate - since the upgrade to 1.4.2 and then 1.5.2 my node is receiving very small amount of data (I don’t have screenshot for May), i.e. before 1.4.2 I was getting dozens of GB of egress per day, but now I’m only getting around 100 MB/day.
You can check the stats at http://giosal.hopto.org:14002

Here’s the screenshot of basic stats:

I’ve also noticed that before 1.5.2 the success rate of upload and repair upload was hovering around 30-35%, but since 1.5.2 it dropped to 10-12%.

========== AUDIT ==============

Critically failed: 0
Critical Fail Rate: 0,000%
Recoverable failed: 0
Recoverable Fail Rate: 0,000%
Successful: 154
Success Rate: 100,000%
========== DOWNLOAD ===========
Failed: 1
Fail Rate: 0,218%
Canceled: 0
Cancel Rate: 0,000%
Successful: 458
Success Rate: 99,782%
========== UPLOAD =============
Rejected: 0
Acceptance Rate: 100,000%
---------- accepted -----------
Failed: 0
Fail Rate: 0,000%
Canceled: 5070
Cancel Rate: 89,608%
Successful: 588
Success Rate: 10,392%
========== REPAIR DOWNLOAD ====
Failed: 0
Fail Rate: 0.000%
Canceled: 0
Cancel Rate: 0.000%
Successful: 0
Success Rate: 0.000%
========== REPAIR UPLOAD ======
Failed: 0
Fail Rate: 0,000%
Canceled: 1413
Cancel Rate: 87,709%
Successful: 198
Success Rate: 12,291%
========== DELETE =============
Failed: 0
Fail Rate: 0,000%
Successful: 697
Success Rate: 100,000%

yeah activity level is basically flat lining at the moment, test data has been stopped for a week and before that it ran for 4 days before it was shut down again because of issues.

it’s to be expected… my successrates dropped severely when upgrading from 1.3.3 to 1.5.2 and i haven’t been able to restore it… to the 80% i where at… for today i think i’m at 63%

13% sounds low tho, but you also cannot trust the successrate number because the logs rapport them incorrectly at the moment…

so yeah you won’t know if its really that bad before that is fixed…
it won’t hurt your node to let it run like it is… i would wait until you can get some actual correct data to adjust your node from.

they will find and fix the incorrect logging issue some time… hopefully soon.
else you can use the current numbers as a benchmark and see what helps it…
tho going through bios settings, and other performance related stuff can take a long time…

the workload is very similar to database worksloads and maybe firewalls… so that can be used as a reference when looking for optimization gains…

Bios is a good place to look… else disk latency, maybe ram or cpu related stuff… but doesn’t really require much computation, but higher frequency might matter…
my server only has 2.1ghz so not going to win any point there … but that managed 80-85% until recently… and i think it was just because i lost my bios configurations that i dropped to 55% or whatever the lowest i hit was…

1 Like

Hardware: Raspberry Pi 2
Bandwidth: 100Mbits down, 50Mbits up, VDSL 100
Location: Germany
Node Version: 1.5.2

       ========== AUDIT ==============
Critically failed:     0
Critical Fail Rate:    0.000%
Recoverable failed:    0
Recoverable Fail Rate: 0.000%
Successful:            875
Success Rate:          100.000%
========== DOWNLOAD ===========
Failed:                65
Fail Rate:             6.035%
Canceled:              40
Cancel Rate:           3.714%
Successful:            972
Success Rate:          90.251%
========== UPLOAD =============
Rejected:              0
Acceptance Rate:       100.000%
---------- accepted -----------
Failed:                0
Fail Rate:             0.000%
Canceled:              121
Cancel Rate:           98.374%
Successful:            2
Success Rate:          1.626%
========== REPAIR DOWNLOAD ====
Failed:                0
Fail Rate:             0.000%
Canceled:              0
Cancel Rate:           0.000%
Successful:            312
Success Rate:          100.000%
========== REPAIR UPLOAD ======
Failed:                0
Fail Rate:             0.000%
Canceled:              22
Cancel Rate:           95.652%
Successful:            1
Success Rate:          4.348%
========== DELETE =============
Failed:                0
Fail Rate:             0.000%
Successful:            434
Success Rate:          100.000%

My Upload sucess rate seems really low, but I have made a “good” 6$ with my 2TB drive last monts so I dont really think it is broken…

Is there an issue?

cancelled uploads are reported wrong in logs… so i would say look at the web dashboard and check that the node is still growing… if so then i wouldn’t worry about it…
at some point the Storjlings will find the error in the programming and fix the log issue.

Alright thank you. Someone should fix the reporting otherwise the sucessrate.sh script is not that insightful…

it’s not the script… it’s some how related to how quickly the computer internally responds to stuff i think… like say your node is getting an upload, then the upload completes… and the system has some processes that needs to be done with that and then before it’s done the cancelled command from the satellites come in… and it gets immediately recorded in the logs…
while the upload is still being proof read or whatever.

its most likely something like that…because it seems to vary alot from computer to computer.

however the system works fine… the satellites will still get the file from your node and your node gets paid and all that… it just logs it wrong…

For what it’s worth I did some manual lookups for pieces that were shown as a canceled upload. 10 out of 10 for the ones I checked were on my storage afterwards. Meaning the transfer did finish. Unfortunately I think that means these numbers are currently virtually useless.
You can follow this bug here: https://github.com/storj/storj/issues/3879

yeah i still haven’t managed to figure out why i dropped 20% in successrates, seems related to bios settings or maybe workload atm because i’m pretty sure i’m back at my previous bios settings.
where i was able to get 80-85%, this morning i was at 61%.

barely even feel like trying to fix it since they are most likely all there anyways…
is a bit odd that it has been consistent for the first 3 months at 75%+ and now is barely able to go past 60

maybe it’s time to write our own way to check a log against the actual files and get a true successrate…