Successrate.sh comparison thread

Its done ty.

========== AUDIT =============
Critically failed: 0
Critical Fail Rate: 0,00%
Recoverable failed: 0
Recoverable Fail Rate: 0,00%
Successful: 55
Success Rate: 100,00%
========== DOWNLOAD ==========
Failed: 5
Fail Rate: 0,67%
Canceled: 33
Cancel Rate: 4,42%
Successful: 709
Success Rate: 94,91%
========== UPLOAD ============
Rejected: 0
Acceptance Rate: 100,00%
---------- accepted ----------
Failed: 2
Fail Rate: 0,01%
Canceled: 22028
Cancel Rate: 83,48%
Successful: 4357
Success Rate: 16,51%
========== REPAIR DOWNLOAD ===
Failed: 0
Fail Rate: 0,00%
Canceled: 0
Cancel Rate: 0,00%
Successful: 0
Success Rate: 0,00%
========== REPAIR UPLOAD =====
Failed: 0
Fail Rate: 0,00%
Canceled: 4399
Cancel Rate: 83,31%
Successful: 881
Success Rate: 16,69%

83% canceled is not to much?

it’s normal, but a bit on the low side… however basically irrelevant.

the cancelled uploads are logged wrong and doesn’t represent the true upload successrate… its a problem everybody has and which the Storj team is aware of, so hopefully it will be addressed sometime soon…

29 posts were split to a new topic: Migrate from RAID5 to RAID6

The cancellation rate is wrong and should be ignored until logging is fixed. It has already been reported as a bug.

2 Likes

Interesting, I had been looking in the forum, but had not found this post. Thank you.

Doesn’t look that good :o

Hardware : i5 2520M, 8GB DDR3 RAM - 2x1TB drives
Bandwidth : 1G down | 55 Mbit/s up
Location : Germany
Node Version : v1.5.2

upload successrates are logged wrong on all nodes, so just ignore that… its most likely closer to your download successrate.

========== AUDIT =============
Successful: 268
Recoverable failed: 0
Unrecoverable failed: 0
Success Rate Min: 100.000%
Success Rate Max: 100.000%
========== DOWNLOAD ==========
Successful: 1741
Failed: 1
Success Rate: 99.943%
========== UPLOAD ============
Successful: 17500
Rejected: 0
Failed: 3
Acceptance Rate: 100.000%
Success Rate: 99.983%
========== REPAIR DOWNLOAD ===
Successful: 1
Failed: 0
Success Rate: 100.000%
========== REPAIR UPLOAD =====
Successful: 4597
Failed: 0
Success Rate: 100.000%

1 Like

You’re using a really outdated and inaccurate script.

Merci et corrigé

========== AUDIT ==============
Critically failed: 0
Critical Fail Rate: 0.000%
Recoverable failed: 0
Recoverable Fail Rate: 0.000%
Successful: 289
Success Rate: 100.000%
========== DOWNLOAD ===========
Failed: 1
Fail Rate: 0.056%
Canceled: 0
Cancel Rate: 0.000%
Successful: 1786
Success Rate: 99.944%
========== UPLOAD =============
Rejected: 0
Acceptance Rate: 100.000%
---------- accepted -----------
Failed: 3
Fail Rate: 0.007%
Canceled: 26390
Cancel Rate: 59.732%
Successful: 17788
Success Rate: 40.262%
========== REPAIR DOWNLOAD ====
Failed: 0
Fail Rate: 0.000%
Canceled: 0
Cancel Rate: 0.000%
Successful: 1
Success Rate: 100.000%
========== REPAIR UPLOAD ======
Failed: 0
Fail Rate: 0.000%
Canceled: 7107
Cancel Rate: 59.324%
Successful: 4873
Success Rate: 40.676%
========== DELETE =============
Failed: 0
Fail Rate: 0.000%
Successful: 23820
Success Rate: 100.000%

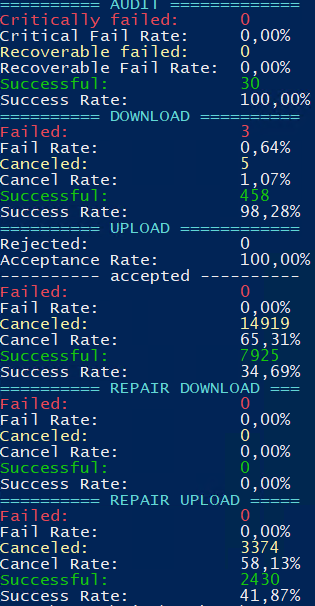
I have this successrate results. Because i have the successrate upload very low? I have a node on VM on Server Proliant DL380g8. The VM is on 4 core Xeon with 4GB ram. The disk of storagenode is a datastore on esxi 6.5u2 in RAID6 on 7 sata hgst 3TB. Controller P822 with 2GB write cache enabled

Cattura3

yesterday somebody else asked about their bad upload successrates…
his was 15% or so maybe a bit less… and mine is closer to 70 atm… not sure why it has dropped, but haven’t been bothered by it…

so we compared our ingress and had exactly the same number off by less that 1% and i had forgotten to update my dashboard… so it was an hour old which most likely made it even closer…

ignore the upload successrates, they are logged wrong… its a storj programming issue
cancelled uploads are not really cancelled…

ok, because i receive data from all satelittes to all nodes normally with 0 errors.

thanks for your feedback.

I noticed that successrate.sh is reporting that I have zero failed deletes even though I’ve seen failed deletes in my log. I don’t know much about linux scripts but line 208 looks suspicious to me. I’ve pasted it below. I’m guessing the “| grep PUT_REPAIR” should not be there?

#count of failed deletes
delete_failed=$($LOG 2>&1 | grep PUT_REPAIR | grep ‘delete failed’ -c)

Wow, that’s an incredibly stupid copy paste mistake. I apologize for that. I’ve corrected it now.

It doesn’t make a difference for my results as I don’t have any failed deletes. But that also means I can’t test it. So please let me know whether you see them show up now. And if not, could you perhaps paste an example of a failed delete line?

2 Likes

Thanks, it’s working now.
delete
Seems to be a malformed pieceinfodb on my node. Node still working, I’ll deal with that later.

1 Like

I appreciate the feedback, thanks! Glad to see confirmation that fixed it.

well this took a while…
but also running a scrub… would be great if it could running it’s counts in parallel or something similar, ofc it’s rare logs gets this expensive lol

see i’m totally ignoring my upload successrate… even tho i find it oddly difficult…

anyways, no failed deletes here, took 15 minutes to complete however… xD

========== AUDIT ==============
Critically failed:     0
Critical Fail Rate:    0.000%
Recoverable failed:    0
Recoverable Fail Rate: 0.000%
Successful:            17258
Success Rate:          100.000%
========== DOWNLOAD ===========
Failed:                141
Fail Rate:             0.096%
Canceled:              2761
Cancel Rate:           1.871%
Successful:            144646
Success Rate:          98.033%
========== UPLOAD =============
Rejected:              0
Acceptance Rate:       100.000%
---------- accepted -----------
Failed:                6
Fail Rate:             0.001%
Canceled:              314558
Cancel Rate:           43.652%
Successful:            406035
Success Rate:          56.347%
========== REPAIR DOWNLOAD ====
Failed:                6
Fail Rate:             0.022%
Canceled:              0
Cancel Rate:           0.000%
Successful:            27894
Success Rate:          99.979%
========== REPAIR UPLOAD ======
Failed:                1
Fail Rate:             0.001%
Canceled:              44403
Cancel Rate:           42.541%
Successful:            59972
Success Rate:          57.458%
========== DELETE =============
Failed:                0
Fail Rate:             0.000%
Successful:            343707
Success Rate:          100.000%

Success rate for 29-07-2020 (CEST) running SN v1.9.5 :

th3van.dk

3 Likes

Thanks for sharing, looks much better upload accepted wise :slight_smile:
I just changed connection yesterday and but still on older version (docker, v1.6.4) and saw an increase from 25% to 40% but with the old upload accepted bug. So as discussed here my ADSL connection was kind of maxed out sometimes. Once docker updates will also post the latest one but your’s looks very promising! PUUURRRFECT almost :slight_smile: