This should be linked here as well:
Did it pass at least one compaction after you enabled memtbl?
Yes many, it’s been running for at long time. But since I havn’t seen the issues, I just assume my setup has sufficient performance to not get caught in these potential issues.
However, I did remove them to align with recommendation and experience by the Storlings. All good ![]()
Can anyone refresh my memory, how to check the state of migration for a node with enabled migration?
I switched ON the active and passive migration, restarted the node, I hear the drives going nuts, but I can’t see anything in the logs related to moving pieces from piecestore to hashstore.
I also grep for this, but nothing:
docker logs storagenode 2>&1 | grep "piecemigrate:chore"
This only shows hashtore opened:
docker logs storagenode 2>&1 | grep "hashstore"
Is there anyother entry?
I have custom info log level:
--log.level=info \
--log.custom-level=piecestore=FATAL,collector=FATAL,blobscache=FATAL \
you can cd into the hashstore directory and run du -sh to check it’s size. Compare that to the du -sh output of the blobs folder and you see how far it is ![]()
I think you need to have this string with active instead of false for each satellite
2025-09-05T07:54:31Z INFO piecemigrate:chore all enqueued for migration; will sleep before next pooling {"Process": "storagenode", "active": {"12L9ZFwhzVpuEKMUNUqkaTLGzwY9G24tbiigLiXpmZWKwmcNDDs": false, "1wFTAgs9DP5RSnCqKV1eLf6N9wtk4EAtmN5DpSxcs8EjT69tGE": false, "121RTSDpyNZVcEU84Ticf2L1ntiuUimbWgfATz21tuvgk3vzoA6": false, "12EayRS2V1kEsWESU9QMRseFhdxYxKicsiFmxrsLZHeLUtdps3S": false}, "interval": "10m0s"}How will the hashstore affect moving nodes?
I believe Rsync has a feature that compares files and transfers only the parts that have changed. So change in one piece should not lead to re-transfer of entire 1GB log files, right?
I don’t know if Rclone has a similar feature otherwise it would be bad if we have to transfer 1GB only because a 256KB file has been appended or deleted or whatever.
But copying a complete node with hashstore (a few thousand files) usually only takes ~a day. So it’s perfectly fine to just shutdown, copy/move and restart.
I had the log poll for that entry set to 1h, that’s why I didn’t see it when I started the migration.
During migration there were these entries:
2025-09-12T05:33:48Z    INFO    piecemigrate:chore      processed a bunch of pieces     {"Process": "storagenode", "successes": 10230000, "size": 2973646968576}
2025-09-12T05:39:18Z    INFO    piecemigrate:chore      processed a bunch of pieces     {"Process": "storagenode", "successes": 10240000, "size": 2975898390528}
Now, the migration is finished and this is the log entry:
INFO    piecemigrate:chore      enqueued for migration  {"Process": "storagenode", "sat": "121RTSDpyNZVcEU84Ticf2L1ntiuUimbWgfATz21tuvgk3vzoA6"}
INFO    piecemigrate:chore      enqueued for migration  {"Process": "storagenode", "sat": "12EayRS2V1kEsWESU9QMRseFhdxYxKicsiFmxrsLZHeLUtdps3S"}
INFO    piecemigrate:chore      enqueued for migration  {"Process": "storagenode", "sat": "12L9ZFwhzVpuEKMUNUqkaTLGzwY9G24tbiigLiXpmZWKwmcNDDs"}
INFO    piecemigrate:chore      all enqueued for migration; will sleep before next pooling      {"Process": "storagenode", "active": {"121RTSDpyNZVcEU84Ticf2L1ntiuUimbWgfATz21tuvgk3vzoA6": true, "12EayRS2V1kEsWESU9QMRseFhdxYxKicsiFmxrsLZHeLUtdps3S": true, "12L9ZFwhzVpuEKMUNUqkaTLGzwY9G24tbiigLiXpmZWKwmcNDDs": true}, "interval": "1h0m0s"}
The speed of migration on an ext4 drive, 512e format, 32GB RAM, was 10000pieces/5.5min.
“-Why are you on 512e format for an Exos X24 24TB drive, still?”
-Because I read on forums about people complaining that trying to fast format it to 4Kn broken the drive.
So, I don’t know what the problem is with this model, but I can’t afford to make it unusable. It’s brand new.
I formated the X22 22TB model without problems, but with this one I won’t try it.
How do you put that code into the grey box? ![]()
Having no issues as of now with 4K, all drives are on 4K as per default.
Yes your migration is complete with the four lines. Congratz. ![]()

If you are a text-only enjoyer, and for whatever reason despise WYSIWYG editors, it’s just normal Markdown
Just enclose your code block in three backticks ` above and below, and you’ll format code
```{optional: Language}
Your code

```
With Powershell as example, it will be rendered like so:
function write-example
{
    Write-Host "You're Cooking with Markdown now"
    Write-Host "this works on multiple lines"
}

PS C:\> write-example
You're Cooking with Markdown now
this works on multiple lines
I wonder if hashstore keeps a minimum free space for compaction? If so is it adjustable or hardcoded? Asking this because I see a hashstore node stopping uploads while dashboard indicating 284 GB free space.
It maybe related to this issue:
And you actually do not have free space, so the usual 5GB is in place.
I wonder how many missing 1 GB data files a node can survive? Asking this because another one of those cursed Toshibas is dying and I might not be able to copy all files to a new location.
New hashstore related config (v1.137) added to config wiki: Config.yaml - Linux/Docker all parameters
I’m also in the process of redoing all of my nodes.
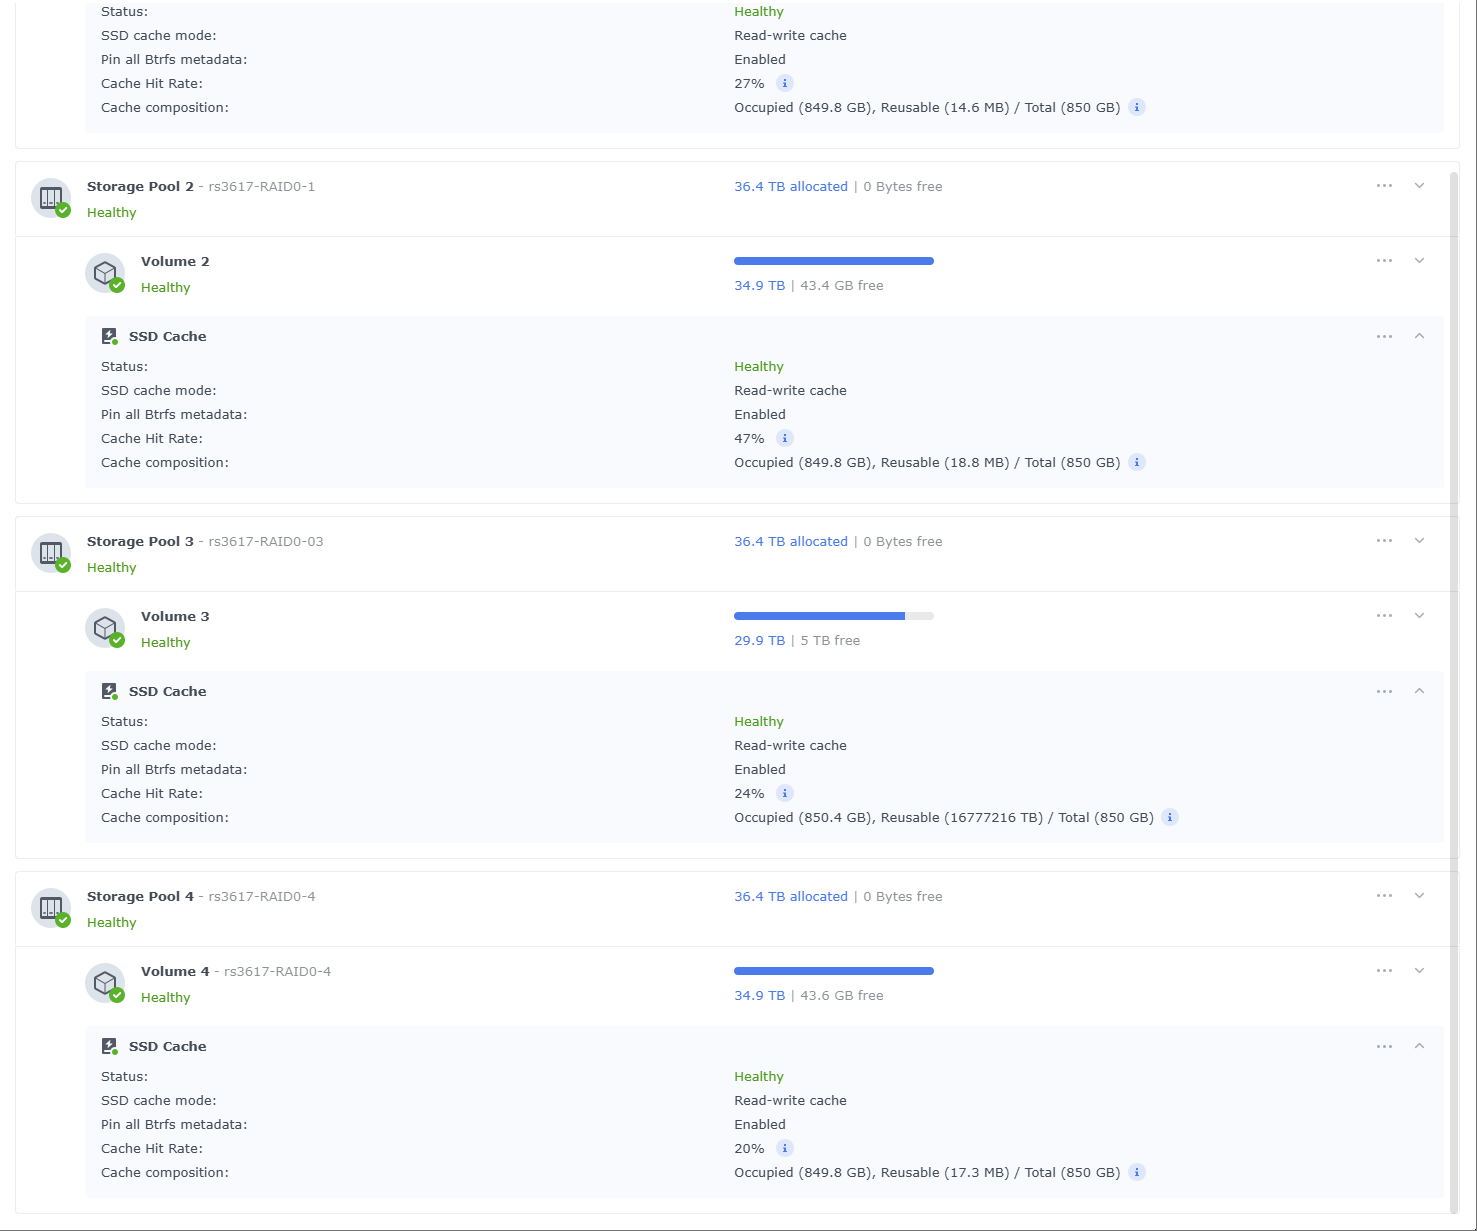
I wrote a script, and have started the migration of my ~100TB of nodes at the same time. To begin with, I had 100% utilization on all drive in the system, but curiously my cache disks (4..9) have dropped heavily.
Why is that, you ask? It is, of course, because the cache layer is completely filled. The mechanical disks are no longer able to handle 100% utilization, because they constantly have to shuffle between reading and writing operations, where they before could write to cache which would flush much more efficiently. Oh well
I’ve been monitoring the process at the SAN level, at the VMhost level, and of course in my guest OSes - it looks like my migration process will be done in 2-3 days ![]()
Great work StorJLads!
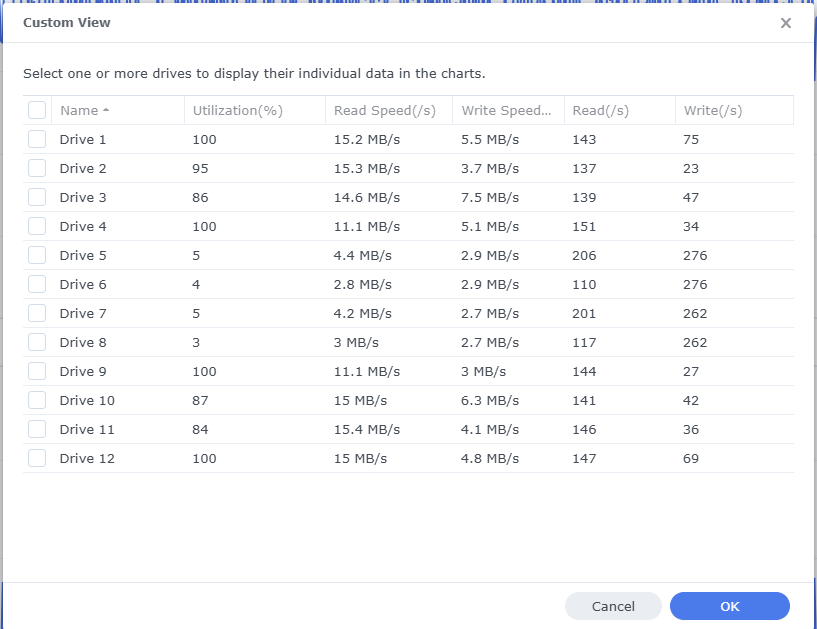
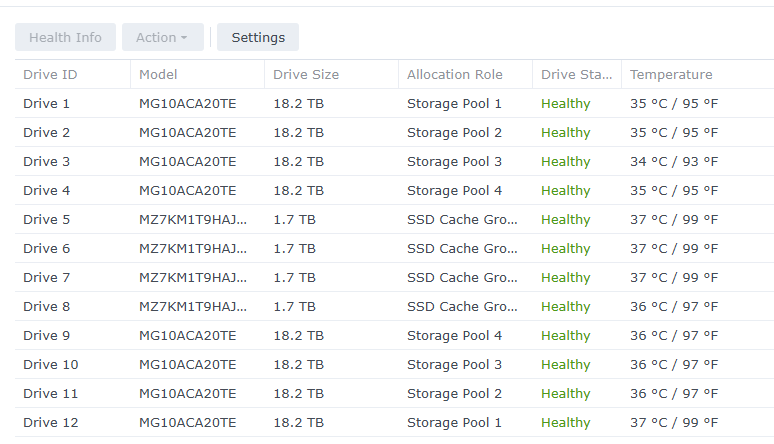
For the curious; here’s the drives that are being targeted:
I see this workload being random read IO seek latency limited, perhaps preemptively, on purpose, which is baffling.
There are four nodes on this host, migrating concurrently. Note disks appear to not be fully utilized:
A bunch of reads (gstat -p):
.002s  w: 1.000s
 L(q)  ops/s    r/s   kBps   ms/r    w/s   kBps   ms/w   %busy Name
    0      0      0      0    0.0      0      0    0.0    0.0| nvd0
    0     52     52    216    0.1      0      0    0.0    0.6| nvd1
    0     57     57    244    0.1      0      0    0.0    0.7| nvd2
    1     50     50   4116   15.6      0      0    0.0   53.2| da0
    4     37     37   2072   15.4      0      0    0.0   40.1| da1
    0     55     55   3893   11.0      0      0    0.0   42.0| da2
    1     58     58   4444   15.2      0      0    0.0   63.6| da3
    2     38     38   2176   14.0      0      0    0.0   40.2| da4
    0     56     56   3837   11.8      0      0    0.0   46.4| da5
    0     55     55   4076   17.9      0      0    0.0   60.4| da6
    3     34     34   2240   11.4      0      0    0.0   36.1| da7
    0     59     59   3665   10.6      0      0    0.0   42.4| da8
    2     47     47   3849   16.4      0      0    0.0   51.8| da9
    2     44     44   2823   13.1      0      0    0.0   44.0| da10
    0     62     62   4667   10.3      0      0    0.0   45.8| da11
    0      0      0      0    0.0      0      0    0.0    0.0| ada0
    0      0      0      0    0.0      0      0    0.0    0.0| ada2
    0      0      0      0    0.0      0      0    0.0    0.0| ada1
Transactional coalesced writes:
dT: 1.002s  w: 1.000s
 L(q)  ops/s    r/s   kBps   ms/r    w/s   kBps   ms/w   %busy Name
    0      0      0      0    0.0      0      0    0.0    0.0| nvd0
    1   2416     49    216    0.1   2367  76794    0.0    6.2| nvd1
    0   2463     41    172    0.1   2422  78335    0.0    6.1| nvd2
    2    320     35    986   16.0    285  50028    1.0   59.5| da0
    0    343     38   1832   13.0    305  58962    0.9   56.4| da1
    0    325     43   1772   18.2    282  51046    0.9   62.5| da2
    2    349     38   1138   17.8    311  50008    0.8   60.7| da3
    0    346     36   1437   12.0    310  58962    0.9   53.0| da4
    0    313     53   2192   11.5    260  51062    1.1   61.2| da5
    2    353     45   1301   18.0    308  50032    0.8   65.1| da6
    0    336     25   1461   17.6    311  58946    0.8   49.5| da7
    0    304     44   1609   19.5    260  51046    1.0   65.9| da8
    1    343     43   1277   16.0    300  50008    0.9   67.0| da9
    0    330     39   1848   12.8    291  58946    1.0   64.3| da10
    0    327     49   1489   12.8    278  51062    1.0   54.7| da11
    0      0      0      0    0.0      0      0    0.0    0.0| ada0
    0      0      0      0    0.0      0      0    0.0    0.0| ada2
    0      0      0      0    0.0      0      0    0.0    0.0| ada1
pool stats(zpool iostat -r)
alex@truenas ~ % zpool iostat -r pool1

pool1         sync_read    sync_write    async_read    async_write      scrub         trim         rebuild
req_size      ind    agg    ind    agg    ind    agg    ind    agg    ind    agg    ind    agg    ind    agg
----------  -----  -----  -----  -----  -----  -----  -----  -----  -----  -----  -----  -----  -----  -----
512             0      0      0      0      0      0      0      0      0      0      0      0      0      0
1K              0      0      0      0      0      0      0      0      0      0      0      0      0      0
2K              0      0      0      0      0      0      0      0      0      0      0      0      0      0
4K           251M      0  46.7M      0  31.0M      0   264M      0  98.9M      0      0      0      0      0
8K          54.7M  1.38K  67.2M    232  19.9M  1.17M  67.0M   108M  27.3M  13.1M      0      0      0      0
16K         35.9M  6.61K  1.73M    612  4.79M  1.93M  62.1M  51.6M  25.4M  21.6M      0      0      0      0
32K         61.7M  10.5K  4.17M  2.94K  68.5M  2.14M   150M  40.3M  56.6M  28.9M      0      0      0      0
64K         8.86M  59.2K   413K  4.48K  4.20M  6.12M  98.4M  34.3M  22.6M  45.0M      0      0      0      0
128K        21.6M  44.8K   657K  1.19K  12.2M  4.57M  5.88M  26.9M  31.2M  40.1M      0      0      0      0
256K        3.85M  8.76K  4.11M  5.55K  1.84M  2.38M  5.44M  15.9M  2.46M  30.9M      0      0      0      0
512K           24    107      0   125K     45   996K  3.75K  20.9M      0  26.1M      0      0      0      0
1M              9      5      0  24.7K      9  4.78K  4.99K   636K      0   732K      0      0      0      0
2M              3      0      0      0      6      0  7.26K      4      0      0      0      0      0      0
4M            381      0      0      0  2.08K      0  7.85K      7      0      0      0      0      0      0
8M              0      0      0      0      0      0      0      0      0      0      0      0      0      0
16M             0      0      0      0      0      0      0      0      0      0      0      0      0      0
------------------------------------------------------------------------------------------------------------
If you look at concurrency – there are barely anything queued. Seems like migration can go faster, but storagenode decides not to.
Is there a tunable for storagenode to tell it to increase migration concurrency? Queue more reads in parallel?
This coroutine handles the migration process: storj/storagenode/piecemigrate/chore.go at 52ae1a8e37ddd58e8f132ae6028600255fb16e15 · storj/storj · GitHub
There’s only one started here: storj/storagenode/piecemigrate/chore.go at 52ae1a8e37ddd58e8f132ae6028600255fb16e15 · storj/storj · GitHub
I don’t see any means to start more of them, but at the same time (disclaimer: I’m still learning golang) I don’t see anything in the code that would make multiple such coroutines working concurrently be a problem… except maybe for collecting statistics.
So, the answer is “no” unless you’re willing to code it yourself, which doesn’t look hard.
Just noticed this flag:
Will give it a try.
Go is very nice. Goroutines and channels are fire. I highly recommend Rob Pike’s talks on youtube to understand motivation for the language and guide intuition development.