I am working on a dashboard and monitoring website for Storj node operators. The goal is to make it easier to track node health, payouts, audits, space usage, uptime, and anything else that helps you run a node with confidence.
Before I go deeper into development, I would love to hear what the community wants. What features matter the most to you
For example:
• A clear view of uptime and audits
• Payout tracking with detailed history
• Email or Telegram alerts when something goes wrong
• Bandwidth and storage charts
• Multiple node support in one place
What would make a dashboard truly useful for your daily operation
Are there pain points you deal with that a tool like this could solve
I am building this for real use, not just a hobby project, so honest feedback is welcome. Tell me what you would want to see, what would help you the most, and even what you dislike about existing tools.
Looking forward to your ideas and suggestions.
Update:
Since my post wasn`t explicit enough, I started developing a “cloud” solution for us Noe Oeprators to monitor our nodes with ease.
Since Storj already has direct support for Prometheus, and there have been a fewcommunityGrafanadashboards… I’d look at those dashboards first for ideas.
It can already send alerts as well: so perhaps your solution can primarily be Grafana reports?
I’m won’t list every metric I care about: but I can say payout and bandwidth data is pretty low priority. I mainly care about cumulative-used-space: to see how much things have grown in the last 2days/7days/month. You also can easily see when bloom filters have been sent out, and data-dropouts that indicate a node isn’t running properl)
Thank you so much for your input, I wasn`t clear enough in my post. I am building a dashboard for any storj node operator, that will monitor your nodes 24/7/365 and send alerts for any issue
What I’m saying is there are already dashboards (Grafana) that monitor nodes 24/7/365 (Prometheus), and send alerts for any issue (Grafana). They ship with a default set of reports (example), and instructions that many SNOs have used to set them up.
I’d look at those default reports to get ideas about what others think is important to track. But obviously you can add your own spin and polish: can’t wait to see!
(The free Grafana+Prometheus combo is popular: and can be used for almost any app. And they both run well in Docker containers: so if you understand how to run Storj … running that combo is going to feel familiar! )
Edit: I forgot: you can look at the Multinode Dashboard for ideas too! Though it’s more of a rollup of raw stats.
While your idea might be useful for some, I for myself would not want my nodes to be connected to some 3rd party website for monitoring.
That’s probably a reason why those self hosted solutions exist. Maybe first ask if there is enough interest in such a solution before investing effort into it.
I can recall we had something similar in the past (again, I am not using it). I think it was this: New dashboard project for SNO
Maybe the greatest appreciation would come for working on the existing Multinode Dashboard and make it finally useful.
AS I like my privacy online, your nodes will not be linked to the website, you will just push monitoring information to an API
. I am doing this for me mainly, and if the community wants it, they can use it
@arrogantrabbit built a dashboard with lots of metrics you can look in his forum post Another AI-generated web dashboard. Unfortunately it looks like he isn’t hosting it anymore to take a look at it, but he made his work public (further down the thread). The dashboard is LLM (AI) generated. What I’m missing in the actual dashboards is something like:
an additional dotted line or something, which predicts the traffic for the end of the day/month (I know you cant extrapolate it that easy depending on how the custumer uses the network, but it would be nice to get a “feeing”)
some sort of a calculator, which predicts ROI (hardware, energy pricing etc.)
how much percent of the earnings are profit and how much goes into running costs
Saturation of the provided bandwidth (for example 100MBit/s from the ISP, Storj uses xxxMBit/s of it)
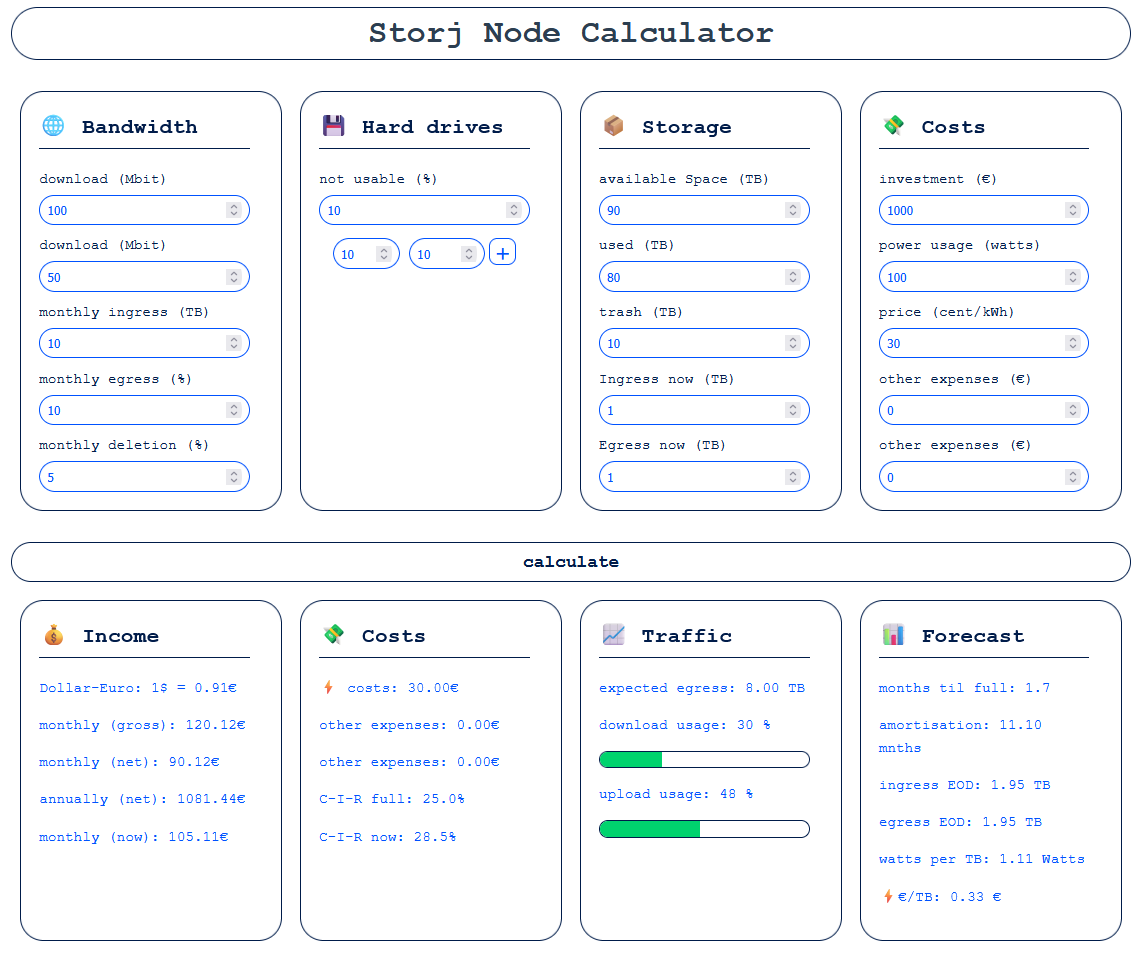
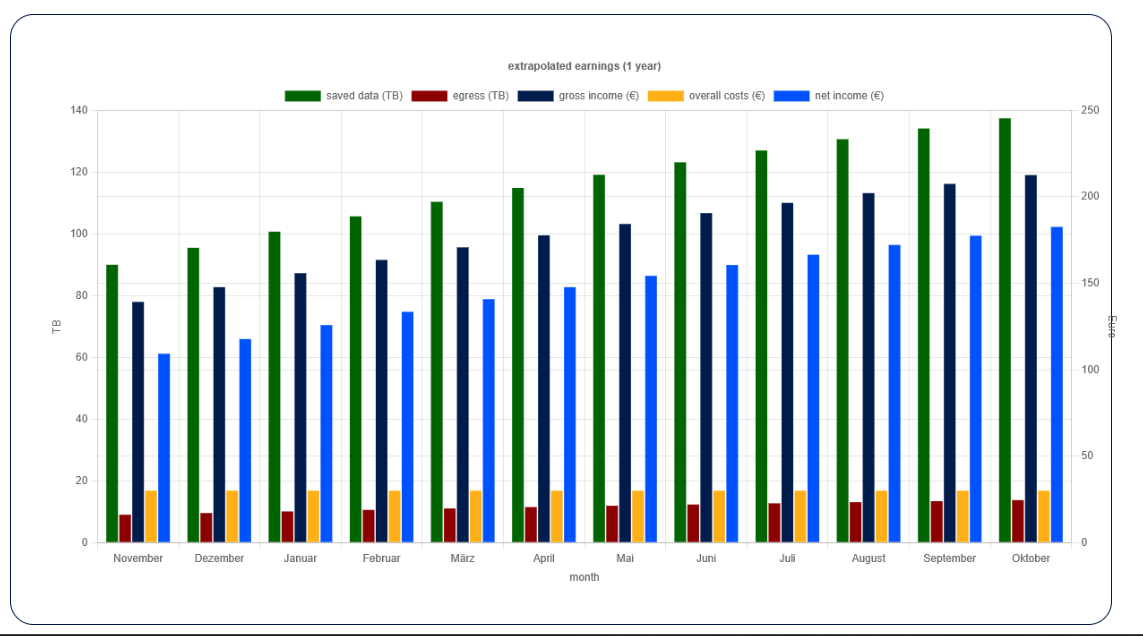
I also tried to build a simple Calculator, via HTML, but I discarded it.
It looks something like that (very janky and some incorrect values). Maybe it gives some inspiration.
You’re exhibiting a miners mentality, which directly goes against the spirit of StorJ - only run on hardware that’s already online, but underutilized.
If you follow what you’re supposed to do, you’re 100% profit from day one, since none of the hardware you’re running have been bought directly for StorJ, the network you’re using would have been online either way and all profits therefore materialize out of thin air.
You should never buy anything to run StorJ, so there will never be an investment. Perhaps of time, but the value of time is measured on many more parameters than money alone.
Not everyone has a large pool or drive to share space with Storj. In such cases, Storj is only profitable if the space you allocate is not needed for your own use. If you buy larger drives just to keep the node running while you still need the space yourself, it’s not really considered pure profit and you would have to gracefull exit. From what I’ve read in the forum, many people use at least one dedicated HDD for Storj, and fire up new ones, if they are full. In that case, you also have dedicated costs, such as the initial investment and at least ongoing power consumption (when the drive you use is an old one you found in the drawer). In this case I think the “miners mentality” is justified.
Storj could tell us the ‘spirit’ also includes every child getting a Unicorn for their 5th birthday. But what happens is SNOs provide storage: and pass availability checks and audits… and Storj pays them every month.
The spirit may include one-drive-per-node… but regardless of how many nodes are on a drive… if SNOs provide the storage Storj sends monthly payments.
The spirit may include no high-availability for drives… but even if parity/mirroring are used… if SNOs provide the storage Storj sends monthly payments.
The spirit may discourage using VPNs for additional IPs… but even if a VPN is used… if SNOs provide the storage Storj sends monthly payments.
And if the spirit encourages using gear that’s already in-use… but even if it’s only bought to be a SNO… guess what… if SNOs provide the storage Storj sends monthly payments.
So I get what you mean. But you know exactly what happens in the real world. Maybe don’t chastise people if they don’t act in accordance to wishes that even Storj only pays lip-service to?
My personal dashboard tracks I/O from the kernel-level physical metrics, docker interface metrics, node-reported I/O to the file system-level and block storage (physical disks and LVM with cache) at 5-sec resolution, and correlates this with events like garbage collection and node-level metrics like scores, rates of uploads/downloads accepted/successful/canceled bucketed per transfer size.