I discovered why my HDDs are working insanely, it’s due to the pieces scan executed oftenly.
When the scan is launched, container scan each file with it name and update .db files
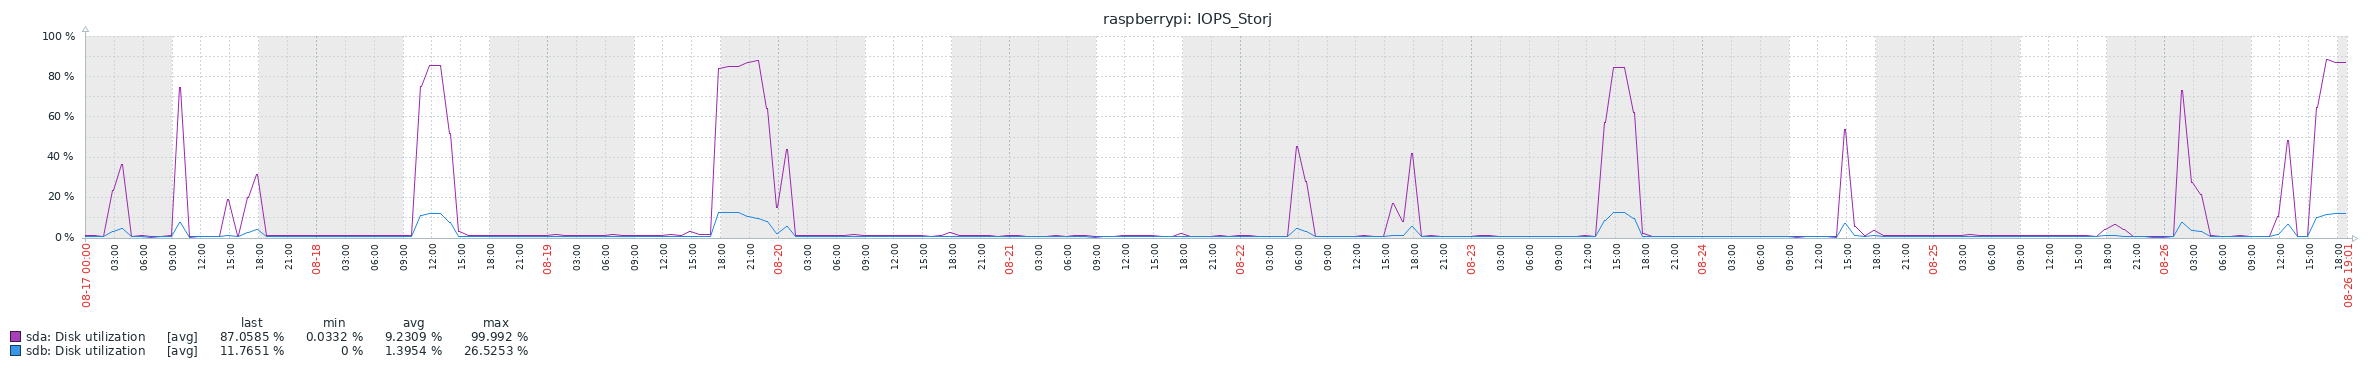
As you can see disk activity is really high
Is it possible to reduce disk usage at arround 20% introducing sleep times between each file lookup ? HDD are approximatively at 100% and operations are very intensive and may impact the HDD lifetime, HDD at 100% is not a good thing, reading list of files and writing per default on the same disk…
In Linux, it could be achieved with ls command with recursivity that we need.
Do Storj have known of this ? Commons disk drives are not made for intensive operations for the long term, and it use mechanical components inside disks. Please introduce piece scanning on the all time long container running, less intensive for HDDs.
Hello! There are only a few situations where the storagenode traverses the directory structure to find all stored files:
When the storagenode process is started, to prime the space-used cache so we know how much space is being used per satellite
When a satellite sends a Retain request (garbage collection): it is necessary to traverse the directory structure in order to see garbage files that do not need to be kept
When graceful exit from a satellite is complete, it is necessary to traverse the directory structure for that satellite in order to delete any remaining files
Case 1 definitely should not be updating .db files in any way connected with the scan. In case 2, it might do some .db updates along the way but only when it finds a file that needs to be trashed, so, hopefully not very often. Case 3 might need to do .db updates, but only if you still have some old pieces stored in FormatV0 (they’d have to have been stored before ~September 2019).
If you have determined (possibly by strace?) that your disk load is mainly caused by a directory traversal, and if your process has been running for more than a few hours, and if you haven’t recently graceful exited from a satellite, I can only surmise that you are seeing case 2- garbage collection. But if you are looking at disk activity in strace and seeing lots of .db file updates in connection with the directory traversal, I would expect to see lots of renameat2() calls as well as garbage files are put into the trash.
If you have some strace output from one of the periods of 100% HDD usage, that might help to identify the problem or the place where a sleep() call would help.
It might also help to be able to correlate your disk load with garbage collection directory traversals; if your node has debug logging, you will see a line that says Prepared to run a Retain request when it starts, and Moved pieces to trash during retain when it ends.
Yes, we don’t want to damage HDDs. If we can identify somewhere to add sleep calls (without harming the storagenode’s response times to clients) that would be a good idea.
ls works in the same way as our directory traversal: readdir() and lstat() calls. It wouldn’t make anything faster.
just do readdir() and lstat() with sleeps implementing ls -alR or with recursive levels (
find -maxdepth 2 -type d -ls) the activity on disk is insane maybe during 4 hours at 100%…
The lifes of the disks may are impacted.
Can you please request this feature for new developpements ?
Best regards to the whole Storj community
Could you provide some information as requested above, so that we can know where the changes need to be made? My node is not observing this behavior, and I don’t know how many others are, if any.
Specifically, I want to know:
how do you know that the disk utilization is caused by a directory traversal?
what .db files are being updated during this directory traversal, and how can you tell?
if the answer to the above questions is something like strace or dtrace, can you share the output? or, if not, can you gather strace output during one of these periods of high disk util?
can you also turn on debug logging and send your storagenode logs during the same period as the strace output, so we can see if it correlates with a garbage collection?
One of my nodes is running on an old Drobo usb 2.0 unit connected to my Synology NAS. Unfortunately the Drobo has an NTFS partition which is probably a large part of the issue, but as it also holds some stuff that I don’t want to move I haven’t been able to reformat it.
Garbage collection on this node takes several hours. And it seems to be getting worse and worse. The current run is already taking more than 11 hours. I know this is the garbage collection process because of the retain lines popping up in the debug log. The retain lines are infrequent though and the amount of data actually being moved to trash is relatively small, which suggests the problem is not the moving of data but the directory traversal.
I know this nodes setup is far from ideal, that’s why I outlined those details first. I did however move the databases for this node to a different location to ease the load on this slow device. Let me know if I can provide more information that could be useful.
Ps. My other 2 nodes don’t have this problem. They are both ext4. One on an SSD accelerated RAID array internal to the Synology and another on an external USB HDD. The USB HDD takes a bit of time to go through this process, but never more than like half an hour. I never even notice this process happening on the internal array, but that’s likely in part because of the SSD cache.
Awesome, that’s good data. Do you know about how many files exist in the directory hierarchy on the Drobo, or how much disk space they take up all together?
How much does node performance suffer while the garbage collection traversal is going on?
This might not be the same case that @Eioz is observing, though- yours might just be going slowly because every lstat() call involves another round trip through usb 2.0 to the device, and we do all the lstat calls sequentially. If that’s the case, then adding sleep calls in between, as Eioz suggests, would have no effect for you other than to make it take even longer.
It’s a thin provisioned volume of 16GB with 4 HDD’s in there (4TB, 3TB and 2x320GB). Usable space after redundancy taken into account would be around 3.6TB. It’s a bit of a messy setup, I basically put all HDD’s I had left in there to make some use of it. There is about 2.4TB in use right now, 1.8TB of which is used by Storj. I don’t have a file count and I dread starting one as that likely will take many hours to get as well.
Barely it seems. I never tried to run this node with the db’s on the same storage though as I was pretty certain that wouldn’t work at all.
I find that surprisingly good considering it’s spending a good chunk of every day on those GC processes.
I do notice that this node has a bit more garbage than the others.
Drobo: 1.8TB stored, 4.2GB trash
Synology: 12.4TB stored, 6.4GB trash
USB3 disk: 1.9TB stored, 516MB trash (full)
Even that is far from bad. I’ve seen nodes report a lot worse.
The Drobo node has about 130GB of space left in the allocation. I’m not going to fill it up entirely as I know these Drobo units start to get horribly slow when they fill up to more than about 85%. So I’m leaving a healthy margin of about 25%. Hopefully these processes will be a little bit easier on the device once it’s no longer accepting uploads.
That’s probably true. It does seem to be impacting the IO wait on my system as well though, which hovers between 15-30% while this is running. In my case I would gladly reduce the frequency of the retain process to at most once a week and simply hold on to garbage a little longer. But I think the timing of this process is currently determined by the satellite. I could be wrong though.
The timing of Retain messages is determined by the satellite, but there is no penalty for a storagenode to ignore Retain messages (other than having garbage live longer than it needs to). If you were to skip all Retain messages for a few days and then process the next one, it would take very slightly longer to perform that gc collection that it would have otherwise (the directory traversal time would remain about the same, but the time to move garbage files into the trash directory would be a little longer because it would be hitting all the garbage files that would have been eliminated earlier).
Maybe we could add a “MinGCInterval” setting that causes the storagenode to ignore Retain messages if they are sent more frequently than the specified interval. That would help a lot for cases like your Drobo where it’s not always worth the disk cost to reclaim space as soon as possible.
Of course, yeah it wouldn’t hurt to skip a few as the next bloom filter will catch the garbage anyway. It would be awesome if such a setting could be added.
I have noticed that at least some of the time, the node moves filws to trash by copying the file and deleting the original. Could this be the reason for the high disk IO load.
I have noticed that on my node a few times, reads and writes to the drive were matched.
That should not ever be happening. Possibly you are seeing a migration of the piece- when a piece is about to be trashed, and the piece was stored with storage format V0 (meaning it was stored by a version of the software from before ~September 2019) then it gets migrated to storage format V1 before we trash it, so that its attributes can be preserved. That does involve rewriting the file.
Why is it necessary to preserve attributes if the file is going to be trashed anyway ? If a file is being restored from trash then converting it to V1 format would make sense. It would certainly lessen rewrites of the file as it will be restricted to files that are going to be part of storage.
These attributes I’m talking about are the uplink signature and the satellite-signed Order Limit, which allow the storage node to prove that it was asked to store that piece and that the piece hasn’t changed. Without them, the piece could not be fully restored. In FormatV0, these attributes are stored in a sqlite database rather than in the piece file itself. It would dramatically complicate the management of that database if it needed to track signatures and order limits for pieces in the trash as well as regular pieces, and there are (relatively) very few FormatV0 pieces left on the network, so it’s not worth much complication or effort to reduce this very minimal point of friction.
In my specific scenario I’m almost certain this isn’t the reason for the disk activity. The number of actual files moved is really low, with a long time in between transfers. But the disk load is constant. So I’m almost certain it’s the directory traversal. But my case is a fairly specific one.
This seems an understatement. There wasn’t more than a few weeks between the last network wipe and the change to store metadata with the files. The amount of these old files are negligible these days. The last time this “move” problem got a lot of attention was when the stefan-benten satellite did some catching up on cleaning zombie segments. And I believe that cleanup did still contain a lot of those old format files. That’s definitely not what I’m seeing on the Drobo node though, since it was started after the new format was implemented.