I read here that overusage may be displayed when allocated disk space is reduced and data not yet deleted.
But this is not the case here it is more the opposite, I kept increasing disk space by demand. I never decreased it.
This is worrying because if I allocate certain amount of disk space it should not get inflated suddenly. What if there was no more space left on the disk?
2 Likes
I can confirm. One of my nodes (where I did not touch the allocation since creation back in January 2019) have overusage of 4.1GB

And it’s actual overusage
$ df
Filesystem      1K-blocks       Used Available Use% Mounted on
udev               415324          0    415324   0% /dev
tmpfs               92996       3132     89864   4% /run
/dev/mmcblk0p2   29542440   15177752  13120312  54% /
tmpfs              464968          0    464968   0% /dev/shm
tmpfs                5120          0      5120   0% /run/lock
tmpfs              464968          0    464968   0% /sys/fs/cgroup
/dev/loop0          50176      50176         0 100% /snap/core18/2289
/dev/loop1          50176      50176         0 100% /snap/core18/2349
/dev/loop2          58880      58880         0 100% /snap/core20/1380
/dev/loop5          62720      62720         0 100% /snap/lxd/22530
/dev/loop4          38784      38784         0 100% /snap/snapd/15183
/dev/loop3          58880      58880         0 100% /snap/core20/1408
/dev/loop7          39680      39680         0 100% /snap/snapd/15318
/dev/loop6          62592      62592         0 100% /snap/lxd/22761
/dev/mmcblk0p1     258095     122560    135535  48% /boot/firmware
/dev/sda1      1921802432 1769143624  54966752  97% /mnt/storj
tmpfs               92992          0     92992   0% /run/user/1000
This is 1K (KiB) blocks. So
1769143624 KiB / 1000 / 1000 / 1000 = 1811.603070976 GB
So it has a total overusage for 11.603070976 GB
The simplified output with si but in GB:
$ df --block-size=1GB
Filesystem     1GB-blocks  Used Available Use% Mounted on
udev                    1     0         1   0% /dev
tmpfs                   1     1         1   4% /run
/dev/mmcblk0p2         31    16        14  54% /
tmpfs                   1     0         1   0% /dev/shm
tmpfs                   1     0         1   0% /run/lock
tmpfs                   1     0         1   0% /sys/fs/cgroup
/dev/loop0              1     1         0 100% /snap/core18/2289
/dev/loop1              1     1         0 100% /snap/core18/2349
/dev/loop2              1     1         0 100% /snap/core20/1380
/dev/loop5              1     1         0 100% /snap/lxd/22530
/dev/loop4              1     1         0 100% /snap/snapd/15183
/dev/loop3              1     1         0 100% /snap/core20/1408
/dev/loop7              1     1         0 100% /snap/snapd/15318
/dev/loop6              1     1         0 100% /snap/lxd/22761
/dev/mmcblk0p1          1     1         1  48% /boot/firmware
/dev/sda1            1968  1812        57  97% /mnt/storj
tmpfs                   1     0         1   0% /run/user/1000
$ sudo du --si -d 1 /mnt/storj/storagenode1/storage
1.8T    /mnt/storj/storagenode1/storage/blobs
9.8G    /mnt/storj/storagenode1/storage/trash
4.1k    /mnt/storj/storagenode1/storage/temp
4.1k    /mnt/storj/storagenode1/storage/blob
4.1k    /mnt/storj/storagenode1/storage/garbage
1.9T    /mnt/storj/storagenode1/storage
$ sudo du --block-size=1GB -d 1 /mnt/storj/storagenode1/storage
1800    /mnt/storj/storagenode1/storage/blobs
9       /mnt/storj/storagenode1/storage/trash
1       /mnt/storj/storagenode1/storage/temp
1       /mnt/storj/storagenode1/storage/blob
1       /mnt/storj/storagenode1/storage/garbage
1809    /mnt/storj/storagenode1/storage
2 Likes
Back to normal:

That is not normal, your free plus used is bigger than your size
That’s from the multinode, which always shows wrong values for free space.
1 Like
The multinode dashboard shows the actual disk free space, not free space in allocation.
The funny thing, that on the main page it shows free space correctly.
What version of the storagenode binary are you running? Do you know when this started?
I have seen this on 2 different nodes. One was only a couple hundred MB, so I was not worried.
However the huge uverusage happened with a v1.49.5 node. I don’t know when it started, but I think I have never seen such an issue ever before 1.49.5.
And it is happening again. 1 node has 18 GB of overusage and I haven’t changed a thing.
This has never happend before version 1.49.5 and seems to happen more frequently recently. But why?
Do you see which part causes the over usage: Trash or Used? Isn’t it just because a lot of temporary files in the trash?
Used space is still below the assigned space.
It might be because of temporary trash files. But I don’t think the node should exceed its total assigned space, even if it is temporary only. As SNO I have no control about how much data gets deleted. So I cannot predict how much more additional spare space I would have to reserve. And we still don’t know what will happen, if there is no more space left in such a case.
Hmm. This is very strange. Just tried to reproduce it locally: I filled up all my storage nodes (using storj-up → a full local cluster) and deleted the files: and it seems to be fine:
{
  "used": 168140800,
  "available": 1000000000,
  "trash": 822749184,
  "overused": 0
}
Trash is full with garbage, but usage is low. Tested and everything is still in the trash.
Checking the code, trying to figure out how is it possible on your side…
Really I have no idea why this is happening. I can only report it when it happens.
The baseline is that for some reason the node keeps adding data despite being full. Full means data + trash exceeds the assigned space. And this should not happen.
So maybe the satellite does not pick up the information in time that the node is full. Or the node does not send this information in time (or even wrong information). Or maybe trash deletion / garbage collection has some issues keeping up. I don’t know.
And again one: DISK SPACE LEFT: -131.43MB
Can confirm here too. Seen on a node still on v1.53.1 (hasn’t auto updated yet) and another that is on v1.54.2. The v1.54.2 has dropped back to no overuse but the v1.53.1 still has some overuse. It isn’t enough for me to be worried about, but I am curious how this can happen as I haven’t made any changes to the node size.

this is why its recommended to keep a good amount of extra capacity just incase this happens… in the future i’m sure we will be able to go closer to the theoretical max.
nodes are continually deleting and getting new ingress… 500MB is ½ a GB
so you are about 1/3600th off in relation to your capacity.
keeping stuff within such narrow limits is quite a challenge in most things.
and these numbers are also estimates i think…
every time the filewalker is run a node counts all files and their sizes and then calculates from there until next time the filewalker is run, usually on node reboots.
so over time it is bound to deviate
OK, this makes sense for me. The overusage showed up after the nodes had been restarted. Interesting though that Storj allows for the reporting to drift so much.
I don’t remember where I had seen a specific recommended number but what I went with making available on my disks, each of which are dedicated to Storj, was about 93%. So that “unshared” 7% that at most I’m only using for backup of some scripts and .bash_history should be more than enough for any Storj overallocation.
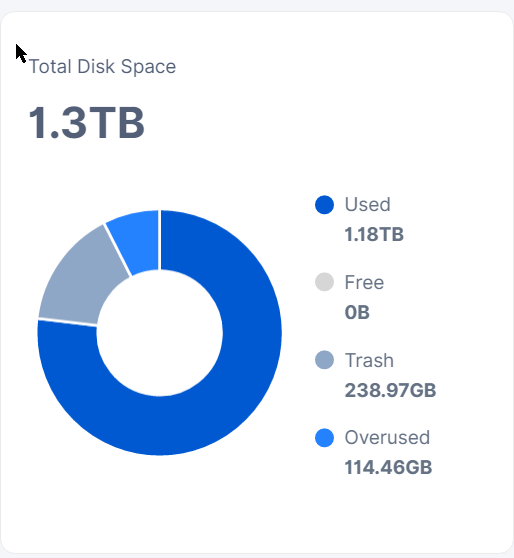
Very interesting point. Today I needed to restart a node and when I check now I see: Overused 11.93GB… ![]()
1 Like
again this isn’t much… lets say a storage node of 2 - 5 TB
12GB deviation is less than 1% and in the 5 TB case less than 0.25%
sure computers should be able to count flawlessly, so it does seem like something is being missed…
like say it might not account for sector sizes on the storage media…
if a 2kb is written a 4k sector is still used, these kinds of things might offset it…
tho it seems to low for being that as i would expect that to be many %
so what else can it be… metadata perhaps… metadata doesn’t take much space, but for each file that is written there will be metadata and storagenodes does write a lot of small files.
or it could be some kind of rounding error… like say one of the variables that is part of the calculation might not use the exact numbers.
let say the filewalker adds up all your storagenodes files… that is a pretty awesome number.
so 2TB would be
2000000000000 adding a 2MB file and its +2000000
ofc the majority of files written initially is much smaller…
more like like say 4000 bytes
so we use 4 bytes just to write the storage of 4000 bytes
than in itself is 0.1% more information required to be stored…
but yeah it does seem like there is most likely something that offsets it…
because atleast in theory it should be able to do the math 100% accurately.
however reality is always imprecise.
also that it can go over might not mean it cannot stop if it runs out of space…
just that it goes over because it can…
Don’t presume too easily. That’s a small node currently holding only around 200 GB.
And nevertheless, it does not matter if 12GB is a lot or not. If the disk runs out of space due to this over usage it does not matter how much it is over the allocated space.