How is this possible?
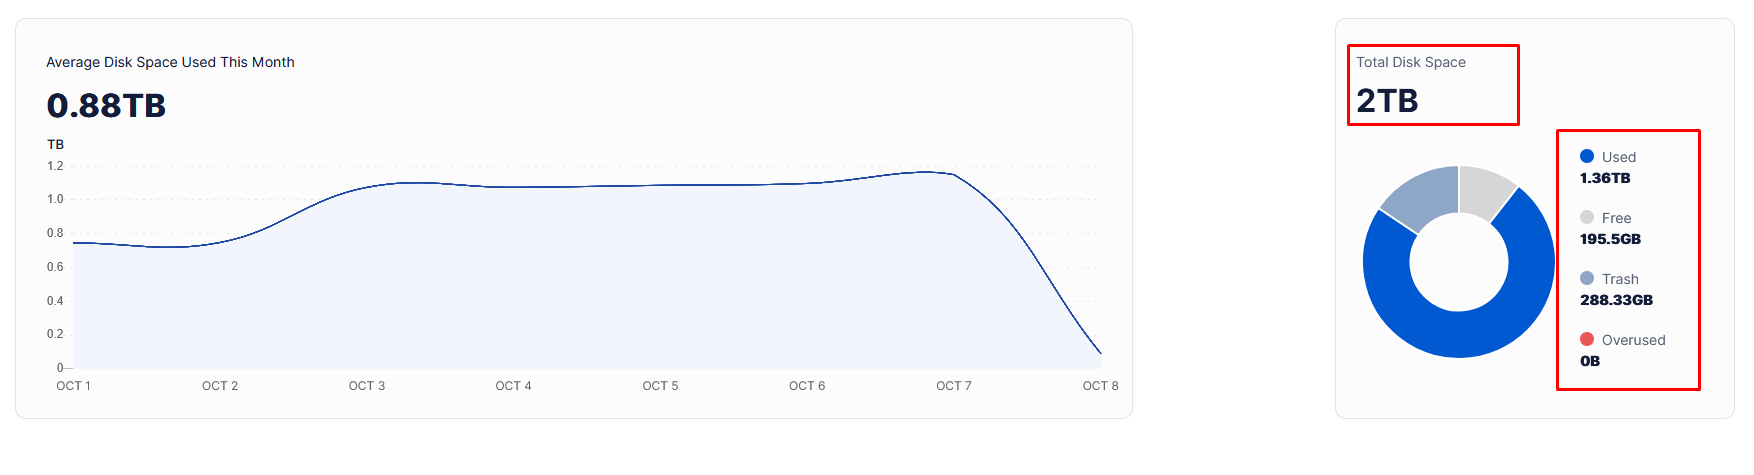
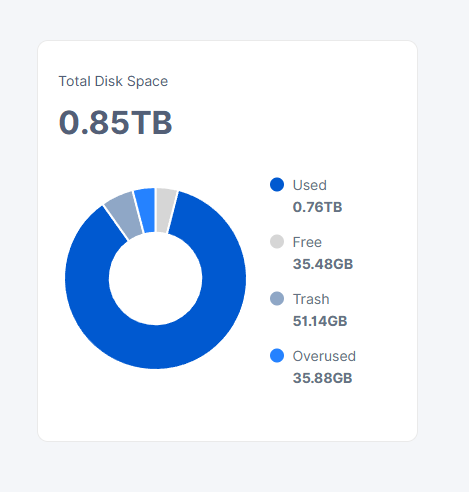
There is free space and also overused:
It is a single node’s dashboard which is migrated to hasstore.
How is this possible?
There is free space and also overused:
it is bug during migration, you can delete databases, then it will reread the real amount, but you will lose stats.
Don’t throw away the databases once the migration is finished, you will only have to throw away the last One, user…space
No. I know about that bug, happened to me as well. I deleted the used space prefix db and it fixed the issue. But this one is not related to it, becouse nothing happens if i delete and recreate that db.
Or which other db should i delete?
witch db did you deleted?
I deleted this one: used_space_per_prefix
Did you restarted the node after? usually you need stop node delete this DB, all other move to other place, start node, new DBs accrue, then stop again node, copy back old DBs, except used_space_per_prefix, start the node
Yes, I did that (again), nothing has changed.
But if I copy everything back (except this one), why do I need to delete them?
Because if only one is missing and others don’t, the node will crash complaining about missing db. I think…
When the node dosen’t find any, then it recreats all dbs.
There is no problem to delete just used_space_per_prefix.db.
Yes, this is one of DBs which can be recreated if only this DB is missing. But this is not always true for all other databases. I believe it’s related to migrations, if the DB doesn’t have migrations, it can be recreated automatically if only this DB is missing. If it has - it will not and you need to use the described workaround with all databases.
So you both @snorkel and @alpharabbit are correct.
How much is used on the disk? Please, use df --si if it’s a dedicated disk or du --si -d 1 /mnt/storj/storagenode/storage
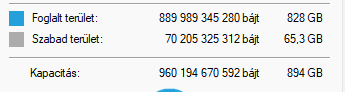
It is running on Windows, so:
Used space: 828GB
Free space: 65,3GB
Total capa: 894 GB
There is zero ingress for the last few days, I guess becouse the overused is more than zero.
828GiB it’s 889GB (Windows shows usage in GiB/TiB/etc. i.e. base 2, but wrongly displays them as GB/TB/etc.). So, if this a dedicated disk, then it’s definitely used more, than allocated 850GB on 49GB, so the dashboard is likely correct about overused, if this is a shared disk with other usage of 129GB.
However, I do not know from where it took 35GB free ![]()
Usually I saw this only on the multinode dashboard, where some nodes can have a free space in the allocated space while the another one has an overusage.
You may measure blobs, hashstore and the trash folders separately, just keep in mind, that it also need to be converted from base 2 to base 10.
I see.. It is a single disc dedicated to StorJ, but I’m not using the dedicated disc option, but set the allocated space to 850GB in the config file.
So the best would be to reduce the allocated space in config file to 800 GB and wait until the real usage go below that and everything will be fine.
Maybe there was a recovery from trash request, which was not successful due to unavailable physical space.
You do not need to do anything, just let it run until the next compaction and likely it will fix itself.
I’m not aware of any emergency right now, and the page https://status.storj.io too
It will not fix over time\compaction. Every node i have has this issue with dashboard and real usage. In multinode dashboard all parameters closer to real usage (free space counted correctly), on local dashaboard - not (ten’s to hundreds GB difference).
When node stops receiving ingress, in multi dashboard i see ~5 GB left, while in local dashboard it shows 50-100 GB free.
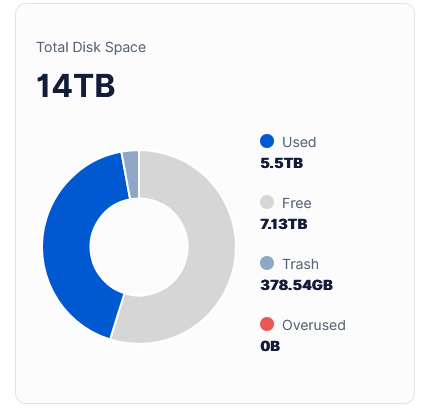
This screen from multinode dashboard
If i take calc and sum all usage values, hundreds gigs lost somewhere (maybe hashtable files not accounted?)
Then you may re-create the prefix database, maybe even all related to storage and restart the node with enabled filewalker (it’s enabled by default).