i am glad am not the only one with this issue my uptime should be 100% on all satellites i have not gotten any uptime robot notifications of downtime in months and this machine only does one storagenode 25 TB.
Would you mind to provide dashboard from the uptimerobot?
And also, please, provide result of the command:
PowerShell
foreach ($item in ((Invoke-WebRequest http://localhost:14002/api/sno).Content | ConvertFrom-Json).satellites.id) {
    ((Invoke-WebRequest http://localhost:14002/api/sno/satellite/$item).Content | ConvertFrom-Json).auditHistory.windows |
        Where-Object{$_.totalCount -ne $_.onlineCount} | ForEach-Object{Write-Host $item; $_ | Format-Table -AutoSize}
}
bash
for item in `curl -sL http://localhost:14002/api/sno | jq '.satellites[].id' -r`; do
    curl -s http://localhost:14002/api/sno/satellite/$item | \
    jq '{id: .id, auditHistory: [.auditHistory.windows[] | select(.totalCount != .onlineCount)]}'
done
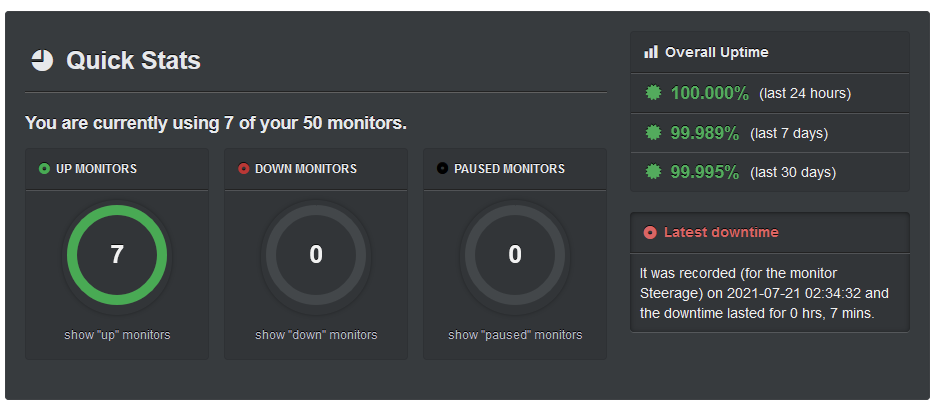
As you can see, your uptime is 99.989% for the last 7 days.
It’s pretty match to what you see on the dashboard.
You also can check what exact days and how long your node was offline on the uptimerobot site.
With provided scripts you can check this information with your storagenode too (but only roughly - they would show your dates when that happened, not the exact time and not how long, but you can divide 12 hours interval on number of audits and multiply to number of success checks, you will get a rought estimation regarding time since the timestamp in the report).
it’s very difficult to keep it at 100% even updating takes time…
and there are only 720 hours in a month… so even 7 minutes of downtime will be 0.01% loss of the 100.00%
on top of that you get 2 updates every month giving you less than 3 minutes of DT for each to keep at like 100% not sure when it rounds up from like 99.95% or whatever…
then because uptime is measured by audits, storagenodes with less data will have higher granularity in the estimated uptime… because thats what it is … and estimate…
if the node has enough data it will be highly accurate to within like a few minutes…
if the node has limited data then you might lose 5 - 10% or even more just for random chance by getting an audit when the node is down and because its rare to get audits that breaks a larger time frame… window or whatever its called…
so best you can possibly hope for is 99.99% and then it will be rounded up to 100%
else random chance might take you to 100% … .but it’s really a near impossible state…
realistic… 99.95% online score and you should be very happy… if your online score keeps dropping you have a problem… if it keeps around 90-100% you most likely don’t have any issue aside from regular maybe instability issues… even a single reboot a month will set you back but a bit… and on some servers one might not even notice its in a cycle of crashing and reboot
but 97% isn’t bad… basically just means you rebooted if its smaller nodes… some will have 100% others will have 97% or whatever… quite random… with limited stored data for a sat
well here is a new screen shot of what the dashbord is displaying, now saltlake sat. has always been a poor performer.

Please, read How is the online score calculated? - Node Operator to understand, how it works.
Hello
I had an issue with my NW provider around Christmas, where I was left without internet for almost 1 day. However, as you can see from the screenshot below at the moment my percentages are still in RED and NOT at 100%. I noticed this after some of the updates, but I don’t remember at which version. Those percentages are like hung for weeks. Do i have to restart the node for the % to refresh?

No
TLDR - Online score is for 30 days. Keep online for 30 days and the score will return to 100%.
OK but i have been up for more than 2 weeks now and those percentages haven’t moved at all. previously after 3 4 days of being online they cleared out or at least started going up towards the 100%. Something was changed or I am mistaking ?
One single offline event affects the Online score for a full 30 days. There is no way around this fact.
The Audit and Suspension scores have shorter lives and are dynamic, so they can change by the minute if an audit failure occurs but is then followed by multiple successful audits.
OK, I understand. But this did not work like that. Something changed. That is what i am asking. What was the change?
I am a StorJ operator for more than 3 years an i have these drops of my internet connection at least 3 or 4 times per year. So I am 100% sure that the program did not react the same way in the past compared to right now.
You can check when your node was offline with these scripts
And when 30 days will pass from the last downtime, it should recover.
OK, here is the output:
PS C:\Windows\system32> foreach ($item in ((Invoke-WebRequest http://localhost:14002/api/sno).Content | ConvertFrom-Json).satellites.id) {
((Invoke-WebRequest http://localhost:14002/api/sno/satellite/$item).Content | ConvertFrom-Json).auditHistory.windows |
    Where-Object{$_.totalCount -ne $_.onlineCount} | ForEach-Object{Write-Host $item; $_ | Format-Table -AutoSize}
}
12tRQrMTWUWwzwGh18i7Fqs67kmdhH9t6aToeiwbo5mfS2rUmo
windowStart totalCount onlineCount ----------- ---------- ----------- 2022-12-15T00:00:00Z 15 14
12tRQrMTWUWwzwGh18i7Fqs67kmdhH9t6aToeiwbo5mfS2rUmo
windowStart totalCount onlineCount
2022-12-15T12:00:00Z 20 18
12tRQrMTWUWwzwGh18i7Fqs67kmdhH9t6aToeiwbo5mfS2rUmo
windowStart totalCount onlineCount
2022-12-16T00:00:00Z 19 2
12tRQrMTWUWwzwGh18i7Fqs67kmdhH9t6aToeiwbo5mfS2rUmo
windowStart totalCount onlineCount
2022-12-16T12:00:00Z 34 0
12tRQrMTWUWwzwGh18i7Fqs67kmdhH9t6aToeiwbo5mfS2rUmo
windowStart totalCount onlineCount
2022-12-17T00:00:00Z 38 3
12tRQrMTWUWwzwGh18i7Fqs67kmdhH9t6aToeiwbo5mfS2rUmo
windowStart totalCount onlineCount
2023-01-03T00:00:00Z 16 15
12tRQrMTWUWwzwGh18i7Fqs67kmdhH9t6aToeiwbo5mfS2rUmo
windowStart totalCount onlineCount ----------- ---------- ----------- 2023-01-03T12:00:00Z 32 28
1wFTAgs9DP5RSnCqKV1eLf6N9wtk4EAtmN5DpSxcs8EjT69tGE
windowStart totalCount onlineCount
2022-12-15T00:00:00Z 14 13
1wFTAgs9DP5RSnCqKV1eLf6N9wtk4EAtmN5DpSxcs8EjT69tGE
windowStart totalCount onlineCount
2022-12-16T00:00:00Z 22 1
1wFTAgs9DP5RSnCqKV1eLf6N9wtk4EAtmN5DpSxcs8EjT69tGE
windowStart totalCount onlineCount
2022-12-16T12:00:00Z 18 0
1wFTAgs9DP5RSnCqKV1eLf6N9wtk4EAtmN5DpSxcs8EjT69tGE
windowStart totalCount onlineCount
2022-12-17T00:00:00Z 18 1
1wFTAgs9DP5RSnCqKV1eLf6N9wtk4EAtmN5DpSxcs8EjT69tGE
windowStart totalCount onlineCount
2023-01-03T00:00:00Z 16 15
1wFTAgs9DP5RSnCqKV1eLf6N9wtk4EAtmN5DpSxcs8EjT69tGE
windowStart totalCount onlineCount ----------- ---------- ----------- 2023-01-03T12:00:00Z 37 32
121RTSDpyNZVcEU84Ticf2L1ntiuUimbWgfATz21tuvgk3vzoA6
windowStart totalCount onlineCount
2022-12-15T00:00:00Z 17 15
121RTSDpyNZVcEU84Ticf2L1ntiuUimbWgfATz21tuvgk3vzoA6
windowStart totalCount onlineCount
2022-12-16T00:00:00Z 12 0
121RTSDpyNZVcEU84Ticf2L1ntiuUimbWgfATz21tuvgk3vzoA6
windowStart totalCount onlineCount
2022-12-16T12:00:00Z 23 0
121RTSDpyNZVcEU84Ticf2L1ntiuUimbWgfATz21tuvgk3vzoA6
windowStart totalCount onlineCount
2022-12-17T00:00:00Z 16 2
121RTSDpyNZVcEU84Ticf2L1ntiuUimbWgfATz21tuvgk3vzoA6
windowStart totalCount onlineCount
2023-01-03T00:00:00Z 22 19
121RTSDpyNZVcEU84Ticf2L1ntiuUimbWgfATz21tuvgk3vzoA6
windowStart totalCount onlineCount
2023-01-03T12:00:00Z 18 16
12EayRS2V1kEsWESU9QMRseFhdxYxKicsiFmxrsLZHeLUtdps3S
windowStart totalCount onlineCount ----------- ---------- ----------- 2022-12-15T00:00:00Z 7 5
12EayRS2V1kEsWESU9QMRseFhdxYxKicsiFmxrsLZHeLUtdps3S
windowStart totalCount onlineCount
2022-12-15T12:00:00Z 8 6
12EayRS2V1kEsWESU9QMRseFhdxYxKicsiFmxrsLZHeLUtdps3S
windowStart totalCount onlineCount
2022-12-16T00:00:00Z 7 2
12EayRS2V1kEsWESU9QMRseFhdxYxKicsiFmxrsLZHeLUtdps3S
windowStart totalCount onlineCount
2022-12-16T12:00:00Z 16 0
12EayRS2V1kEsWESU9QMRseFhdxYxKicsiFmxrsLZHeLUtdps3S
windowStart totalCount onlineCount
2022-12-17T00:00:00Z 11 1
12EayRS2V1kEsWESU9QMRseFhdxYxKicsiFmxrsLZHeLUtdps3S
windowStart totalCount onlineCount
2023-01-03T00:00:00Z 11 10
12EayRS2V1kEsWESU9QMRseFhdxYxKicsiFmxrsLZHeLUtdps3S
windowStart totalCount onlineCount
2023-01-03T12:00:00Z 14 13
12L9ZFwhzVpuEKMUNUqkaTLGzwY9G24tbiigLiXpmZWKwmcNDDs
windowStart totalCount onlineCount
2022-12-13T12:00:00Z 1 0
12L9ZFwhzVpuEKMUNUqkaTLGzwY9G24tbiigLiXpmZWKwmcNDDs
windowStart totalCount onlineCount
2022-12-14T00:00:00Z 1 0
12L9ZFwhzVpuEKMUNUqkaTLGzwY9G24tbiigLiXpmZWKwmcNDDs
windowStart totalCount onlineCount
2022-12-15T00:00:00Z 1 0
12L9ZFwhzVpuEKMUNUqkaTLGzwY9G24tbiigLiXpmZWKwmcNDDs
windowStart totalCount onlineCount
2022-12-17T00:00:00Z 1 0
12L9ZFwhzVpuEKMUNUqkaTLGzwY9G24tbiigLiXpmZWKwmcNDDs
windowStart totalCount onlineCount
2022-12-18T12:00:00Z 1 0
12L9ZFwhzVpuEKMUNUqkaTLGzwY9G24tbiigLiXpmZWKwmcNDDs
windowStart totalCount onlineCount
2022-12-20T00:00:00Z 1 0
12L9ZFwhzVpuEKMUNUqkaTLGzwY9G24tbiigLiXpmZWKwmcNDDs
windowStart totalCount onlineCount
2022-12-20T12:00:00Z 1 0
12L9ZFwhzVpuEKMUNUqkaTLGzwY9G24tbiigLiXpmZWKwmcNDDs
windowStart totalCount onlineCount
2022-12-21T00:00:00Z 1 0
12L9ZFwhzVpuEKMUNUqkaTLGzwY9G24tbiigLiXpmZWKwmcNDDs
windowStart totalCount onlineCount
2022-12-22T12:00:00Z 1 0
12L9ZFwhzVpuEKMUNUqkaTLGzwY9G24tbiigLiXpmZWKwmcNDDs
windowStart totalCount onlineCount
2022-12-24T12:00:00Z 1 0
12L9ZFwhzVpuEKMUNUqkaTLGzwY9G24tbiigLiXpmZWKwmcNDDs
windowStart totalCount onlineCount
2022-12-26T12:00:00Z 1 0
12L9ZFwhzVpuEKMUNUqkaTLGzwY9G24tbiigLiXpmZWKwmcNDDs
windowStart totalCount onlineCount ----------- ---------- ----------- 2022-12-27T12:00:00Z 2 0
12L9ZFwhzVpuEKMUNUqkaTLGzwY9G24tbiigLiXpmZWKwmcNDDs
windowStart totalCount onlineCount
2022-12-28T12:00:00Z 1 0
12L9ZFwhzVpuEKMUNUqkaTLGzwY9G24tbiigLiXpmZWKwmcNDDs
windowStart totalCount onlineCount
2023-01-01T00:00:00Z 1 0
12L9ZFwhzVpuEKMUNUqkaTLGzwY9G24tbiigLiXpmZWKwmcNDDs
windowStart totalCount onlineCount
2023-01-03T12:00:00Z 1 0
12L9ZFwhzVpuEKMUNUqkaTLGzwY9G24tbiigLiXpmZWKwmcNDDs
windowStart totalCount onlineCount
2023-01-04T00:00:00Z 1 0
12L9ZFwhzVpuEKMUNUqkaTLGzwY9G24tbiigLiXpmZWKwmcNDDs
windowStart totalCount onlineCount
2023-01-05T00:00:00Z 1 0
12L9ZFwhzVpuEKMUNUqkaTLGzwY9G24tbiigLiXpmZWKwmcNDDs
windowStart totalCount onlineCount
2023-01-08T12:00:00Z 2 0
12rfG3sh9NCWiX3ivPjq2HtdLmbqCrvHVEzJubnzFzosMuawymB
windowStart totalCount onlineCount
2022-12-14T12:00:00Z 27 26
12rfG3sh9NCWiX3ivPjq2HtdLmbqCrvHVEzJubnzFzosMuawymB
windowStart totalCount onlineCount
2022-12-15T00:00:00Z 26 24
12rfG3sh9NCWiX3ivPjq2HtdLmbqCrvHVEzJubnzFzosMuawymB
windowStart totalCount onlineCount
2022-12-15T12:00:00Z 26 23
12rfG3sh9NCWiX3ivPjq2HtdLmbqCrvHVEzJubnzFzosMuawymB
windowStart totalCount onlineCount
2022-12-16T00:00:00Z 21 1
12rfG3sh9NCWiX3ivPjq2HtdLmbqCrvHVEzJubnzFzosMuawymB
windowStart totalCount onlineCount
2022-12-16T12:00:00Z 38 0
12rfG3sh9NCWiX3ivPjq2HtdLmbqCrvHVEzJubnzFzosMuawymB
windowStart totalCount onlineCount
2022-12-17T00:00:00Z 40 3
12rfG3sh9NCWiX3ivPjq2HtdLmbqCrvHVEzJubnzFzosMuawymB
windowStart totalCount onlineCount
2023-01-03T00:00:00Z 32 29
12rfG3sh9NCWiX3ivPjq2HtdLmbqCrvHVEzJubnzFzosMuawymB
windowStart totalCount onlineCount
2023-01-03T12:00:00Z 33 29
it is a bit messy and i don’t quite understand it
It has always worked like that. It’s just the percentage of online time in the past 30 days. So until your downtime ages out of that, you won’t see that number increase. It’s nothing to worry about though, just keep your nodes online and it’ll resolve itself after you’ve been online for 30 days.
Edit: Scrolling through your results, you seem to consistently have offline checks in every window. totalCount - onlineCount should be 0 normally. You’re missing the most recent days in your post though. Is this now resolved?

i think i understood what you mean.
Does that script show only the days when you have issues? Because my issue could be resolved on 3rd of January. Because i don’t see messages after that. But that is a bit disappointing that all should remain like that until 3rd of February.
Yeah, it does. I should have looked at that better. So it seems you have indeed resolved the issues since then.
Your offline score doesn’t impact anything unless it drops below 60% though, so I wouldn’t worry about it being low for 30 days. It’s just a cosmetic annoyance. (I know that can still be annoying, I’m dealing with something similar right now due to a hardware failure.)
yes, that red % really puts me down. ![]()
anyway, i will wait 2 or 3 more weeks and if it does not improve i will dropa a message here again.
thank you for clarifying the topic to me.