Hi guys.
Please provide me your insights as this doesn´t make any sense:
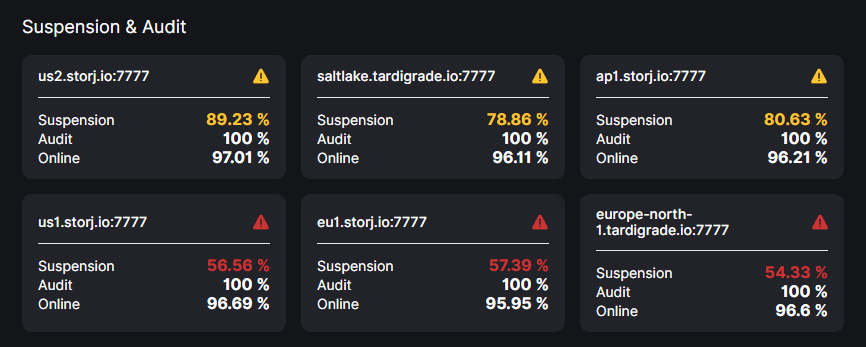
How´s this even possible considering it shows over 95% online?
Hi guys.
Please provide me your insights as this doesn´t make any sense:
How´s this even possible considering it shows over 95% online?
Hi. You need to have a look into the log files - I assume your files are corrupt and could not be audited. Please analyze and share an excerpt of the errors from your logs.
Edited 2:
What command should I use to have those logs?
Using sudo docker logs --follow --tail 50 storagenode I can´t see erros, just uploads and downloads.
In the time I posted this now I have this:
Something is not correct.
I also add that this node is over 2 years old.
One hour later:
Could this be something related to 1.47.3?
There are two events which can lead to suspension:
You have a second, very dangerous case.
Please, check your logs why your node failed audits with unknown errors: https://support.storj.io/hc/en-us/articles/360042257912-Suspension-mode
Hi Alexei,
No output:
And this is the current dashboard:
Very odd…did it recover so fast from suspension?
Please, try to search for ERROR instead of failed.
By the way, did you re-create a container? If so, then your previous logs are lost. So may be we will never know what’s was the reason.
Yes, the recovering from suspension when the suspension score is affected could be fast, if the problem were fixed, unlike online score. Because suspension score is recovering with the each successful audit.
Keep going!
grep is case sensitive, you have to search for ERROR or add -i parameter.
Your node is quite old, which means it gets a lot of audits and repair. This causes scores to respond really fast. So fast drops and fast recovery. I think you may have had a really temporary issue.
@Alexey: I am noticing issues with dropping suspension are happening more frequently recently. And unlike before it seems we haven’t been able to determine the cause of the suspension in many of the cases. I don’t really know what the commonality between these cases is yet, but it may be good to mention this to the team to see if they have some idea what might be causing this. Mean while, lets keep an eye out for more reports. It’s clearly not a massive issue yet as the forum would be flooded with reports if that were the case. But we haven’t really seen reports to this extent before either. And the reports we have seen were usually easily clarified. I am especially curious since this is now happening to a long time node operator like @naxbc. Checking back, they have had drops in suspension score before, but seemingly always with clearly identifiable cause. (Disk mount issues, old version, things like that) Food for thought.
Thank you, didn’t know that.
Will repeat the process with capital letters and report back.
Worth mentioning I have a daily reboot scheduled and this happened on a Synology DS 412+ latest DSM.
I know I didn’t had downtime; I have UpTimeRobot monitoring and also have fairly IT knowledge as I’m an Sys Admin.
I’m also replicating data to a Windows computer while the node is running using robocopy in order to expand it.
Still, the sync process is running for over 9 days and only now this happened.
Let me know if I can be helpful in some troubleshooting for the community.
This could put significant load on your storage though. It’s possible that caused audits to time out. Also be careful with the db files. You don’t want to copy them over SMB with the node running as that could lead to corruption.
That underlines my thoughts on my recent suspension issues down to ~70%, related to issues mentioned in this post: everything which could block db reads/writes can cause damage to the node somehow. In my case Time Machine backups on MacOS; before that, SMB issues as well.
Nevertheless, I use all these learnings and failures to extend and tune the health check monitoring script - I strongly advise to use that, in case you don’t have a monitoring tool to recognize errors yet.
I made the experience it makes you nervous, when alerts are fired, but you can react very quickly, before seeing your node being suspended or disqualified:
Thank you @BrightSilence and @Bivvo for your insights; could make sense.
On the other hand, shoudn´t it appear as such in the logs?
Btw, any suggestions on how to sync data between Synology and Windows? Tried rsync but I was unable to make it run on Windows 10.
Mapping Synology Volume on Windows and use Robocopy was the only method working.
Taking a huge amount of time thought 
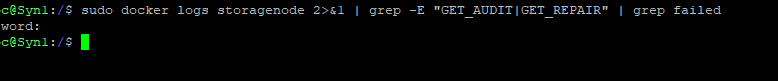
@Alexey nothing with capitals:
That’s fine for migrating blobs and trash. The rest is tiny anyway. Just migrate those and copy the rest when the node is stopped during the last robocopy run.
If you had audit failures, this should work:
docker logs storagenode 2>&1 | grep -E 'GET_AUDIT' | grep 'failed'
In case of other fatal issues:
docker logs storagenode 2>&1 | grep 'FATAL'
General errors:
docker logs storagenode 2>&1 | grep 'ERROR' | grep -v -e 'INFO' -e 'FATAL' -e 'collector' -e 'piecestore' -e 'pieces error: filestore error: context canceled' -e 'piecedeleter' -e 'emptying trash failed' -e 'service ping satellite failed'

docker logs storagenode 2>&1 | grep -i -e 'error:' -e 'fatal:' -e 'unexpected shutdown' -e 'fatal error' -e 'transport endpoint is not connected' -e 'Unable to read the disk' -e 'software caused connection abort' | grep -v -e 'emptying trash failed' -e 'INFO' -e 'FATAL' -e 'collector' -e 'piecestore' -e 'pieces error: filestore error: context canceled' -e 'piecedeleter' -e 'emptying trash failed' -e 'service ping satellite failed'
(Statements can be tuned for sure.)
grep GET_AUDIT in combination with ERROR won’t work.
Hrmm, this may have been premature if two of these have now at least partially been explained.
You need to add GET_REPAIR too, it affects audits as well.
Let me advertise my grafana dashboard here as well: [Tech Preview] Email alerts with Grafana and Prometheus
It doesn’t help you to find out what happened before but it will help you in case this might happen again. The grafana dashboard can send you an email alert as soon as your audit success rate is too low.